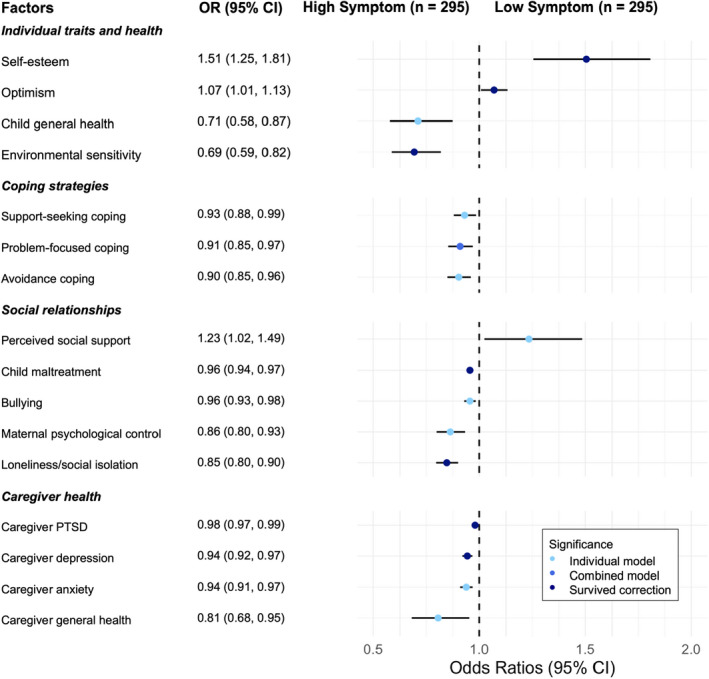
Figure 2.

Logistic regression results for the factors that significantly predicted low/high symptom group membership. Forest plot and associated table, showing the odds rations and 95% confidence intervals from the individual logistic regression models for the factors that significantly predicted LS or HS group membership. Note: OR, odds Ratio; CI, Confidence Interval. Factors highlighted light blue for ‘Individual model’ were significant predictors of group only in individual models. Those highlighted royal blue for ‘Combined model’ remained significant when entered into the model combining all individually significant predictors. Those highlighted dark blue for ‘Survived correction’ are the factors that remained when correction for multiple was made in the combined model [Color figure can be viewed at wileyonlinelibrary.com]
