Figure 2.
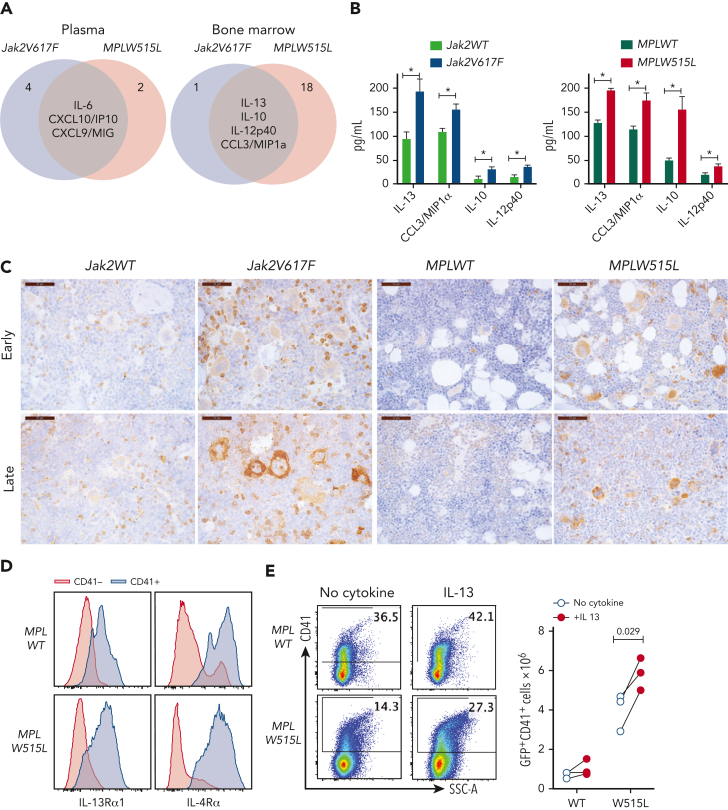
The IL-13 pathway is upregulated in MPN mouse models. (A) Venn diagram showing the cytokines that were upregulated in both Jak2V617F and MPLW515L mice in the plasma or BM. (B) Cytokine concentrations in the BM of Jak2V617F and MPLW515L mice and their respective controls. Data represent the mean ± standard error of the mean (SEM). N = 3 to 5. ∗P < .05, ∗∗P < .01. (C) Expression of IL-13Rα1 by immunohistochemistry in BM sections of mice from the indicated genotypes at early and late time points. (D) Expression of IL-13Rα1 and IL-4Rα in CD41+ megakaryocytes derived in vitro for 4 days after transduction of HSPCs with MPLWT or MPLW515L retroviruses. (E) In vitro cultures of HSPCs transduced with MPLWT or MPLW515L retroviruses cultured with no cytokines or in the presence of IL-13 for 4 days. Expression of CD41 was measured by flow cytometry. Total number of CD41+ cells in culture is shown (right). Each dot represents a biological replicate. Data from 3 independent experiments are shown. Paired Student t test was used for statistical analysis. MIP1a, macrophage inflammatory protein 1a; SSC-A, side scatter area.

