Figure 4.
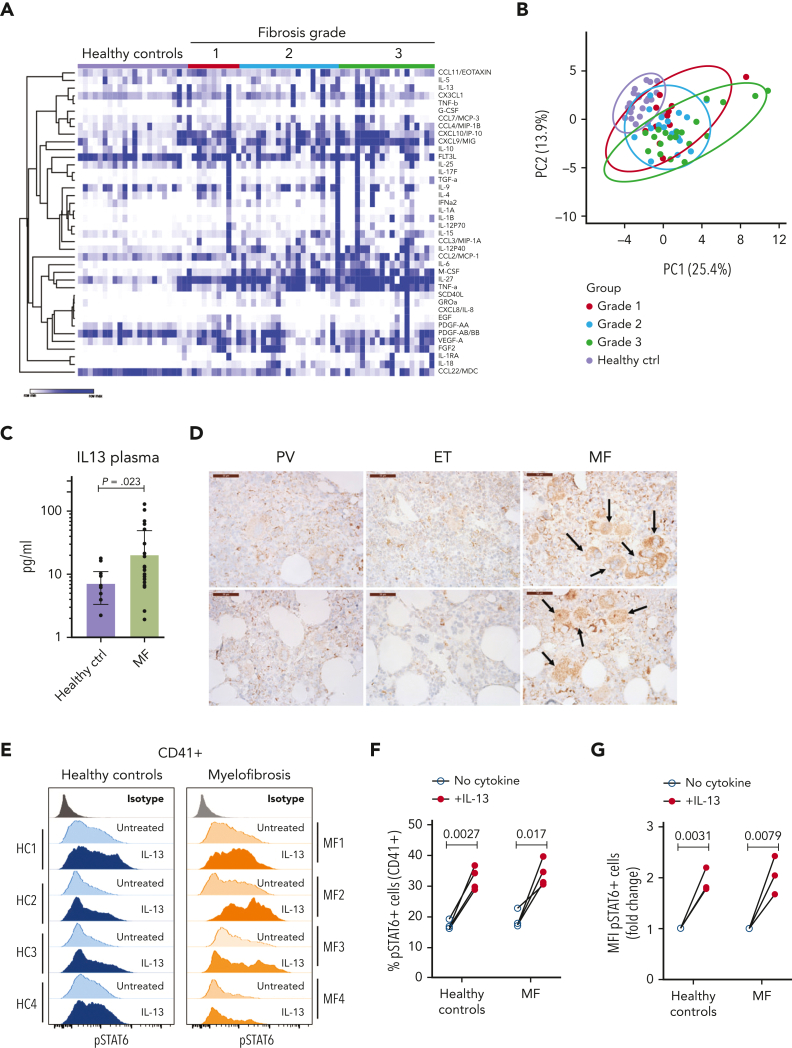
The IL-13 signaling pathway is activated in patients with MF. (A) Heat map of cytokines detected in the plasma of healthy controls and patients with MF (grouped by fibrosis degree). N = 11 to 20 samples per group. (B) Principal component analysis of samples shown in panel A. (C) Levels of IL-13 in plasma samples from healthy controls or patients with MF were not grouped based on fibrosis degree. P value was derived using the Mann-Whitney test with Benjamini, Krieger, and Yekutieli corrections. Data represent the average ± SEM. (D) Immunohistochemistry for IL-13Rα1 in human BM biopsies from patients with polycythemia vera, essential thrombocythemia, or MF. Scale bar, 50 μm. Black arrows indicate megakaryocytes with high IL-13Rα1 expression of the MF samples. Each image represents a different sample. (E) Representative flow cytometry plot of STAT6 phosphorylation in response to IL-13 stimulation in human megakaryocytes derived from healthy controls or patients with MF measured by flow cytometry. (F) Percentage of pSTAT6-positive cells gated on megakaryocytes CD41+. (G) Mean fluorescence intensity of pSTAT6-positive CD41+ cells. Paired Student t test was used for statistical analysis. ctrl, control; EGF, endothelial growth factor; ET, essential thrombocythemia; FGF2, fibroblast growth factor 2; HC, healthy control; MFI, mean fluorescence intensity; PDGF, platelet-derived growth factor; PV, polycythemia vera.

