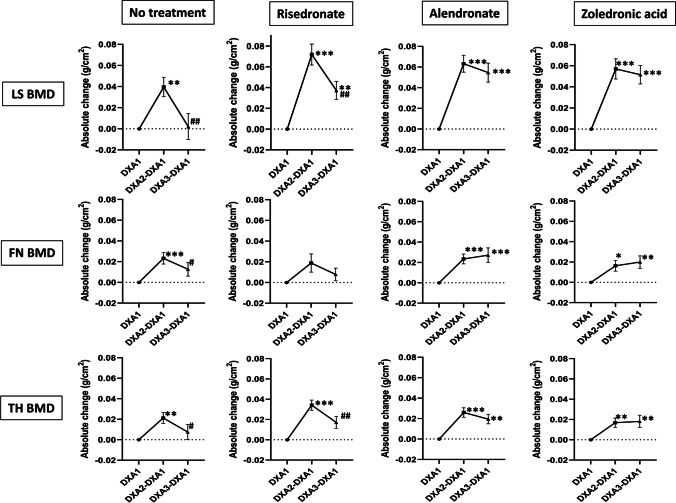
Fig. 2.
Absolute change (mean ± SEM) in LS, FN, and TH BMD during denosumab treatment and after receiving no subsequent therapy or received subsequent treatment with risedronate, alendronate, or zoledronic acid. DXA1 (baseline), BMD at the time of Dmab initiation; DXA2-DXA1, BMD gained during Dmab treatment; DXA3-DXA1, BMD after Dmab discontinuation (± subsequent therapy) when compared to DXA1 (baseline); SEM, standard error of the mean; LS, lumbar spine; FN, femoral neck; TH, total hip; BMD, bone mineral density; DXA, dual-energy X-ray absorptiometry; Dmab, denosumab. Differences were compared using paired t-tests. *Significant change when compared to Dmab initiation (*p value < 0.05; **p value < 0.01; ***p value < 0.001). #Significant change when compared to Dmab discontinuation (#p value < 0.05; # #p value < 0.01)

