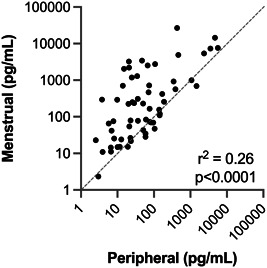
Figure 1.

Correlation of mean peripheral and menstrual effluent cytokine profiles. Mean levels of 62 cytokines in systemic versus menstrual effluent samples from n = 7 subjects shown on a log‐log scale. Linear regression values r 2 = 0.26, p < 0.0001. Gray dashed line indicates the equality line for a 1:1 correlation. For 48/62 cytokines, mean menstrual effluent levels are above the equality line
