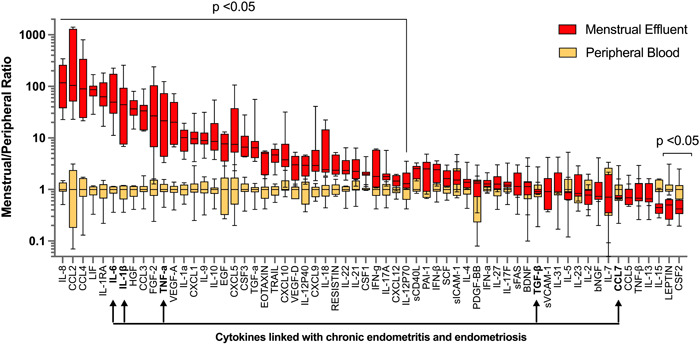
Figure 2.

Fold change in cytokine levels in menstrual versus peripheral blood samples.
Menstrual levels of each cytokine were normalized to the systemic blood levels of each patient. Graph depicts median and min/max for normalized menstrual and systemic blood levels for each cytokine. Differences between groups were tested by Wilcoxon matched‐pairs signed rank test. Multiple comparisons method: two‐stage linear step‐up procedure of Benjamini, Kireger and Yekutieli, at desired false discovery rate (q) = 5%. FDR‐adjusted p‐values are depicted. Arrows indicate cytokines in endometrial tissues that are associated with chronic endometritis and endometriosis. FDR, false discovery rate
