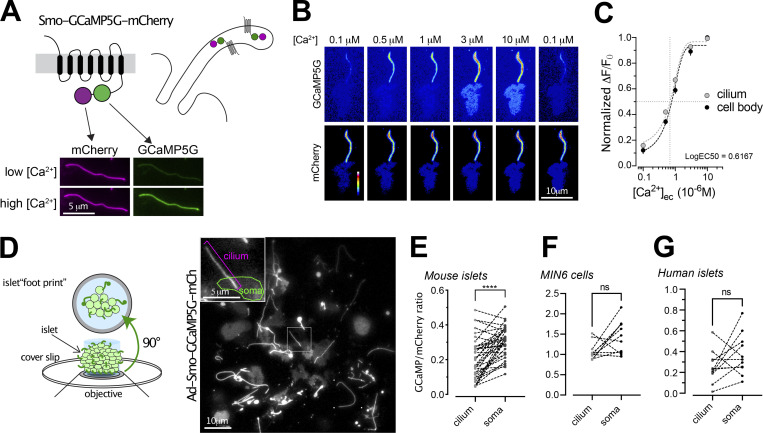
Figure 3.
Measurements of cilia Ca2+ in intact islets of Langerhans. (A) Schematic illustration showing the principle of the ratiometric cilia-targeted Ca2+ indicator Smo-GCaMP5G-mCh. (B) TIRF microscopy images of Smo-GCaMP5G-mCherry fluorescence from MIN6 cells. The cells were permeabilized with α-toxin and exposed to the indicated Ca2+-buffer. Top row shows fluorescence change of GCaMP5G in response to the different Ca2+ buffers, while the bottom row shows the corresponding change in mCherry fluorescence. (C) Dose-response curves for the GCaMP5G/mCherry fluorescence change in the cilium and cell body of permeabilized MIN6 cells exposed to the indicated Ca2+ buffers (n = 8 cells). (D) Principle of TIRF microscopy imaging of primary cilia in intact islets of Langerhans. An image of the footprint of a mouse islet with protruding cilia is shown to the right. (E) Quantifications of the resting GCaMP5G/mCherry fluorescence in the cilia and soma of mouse islet cells shows that the Ca2+ concentration is lower in the cilium (n = 39; **** P < 0.0001; paired, two-tailed Student’s t test). (F) Quantifications of the resting GCaMP5G/mCherry fluorescence in the cilia and soma of MIN6 cells shows that there is no difference in Ca2+ concentration between the two compartments (n = 12; paired, two-tailed Student’s t test). (G) Quantifications of the resting GCaMP5G/mCherry fluorescence in the cilia and soma of human islet cells shows that there is no difference in Ca2+ concentration between the two compartments (n = 11; paired, two-tailed Student’s t test).

