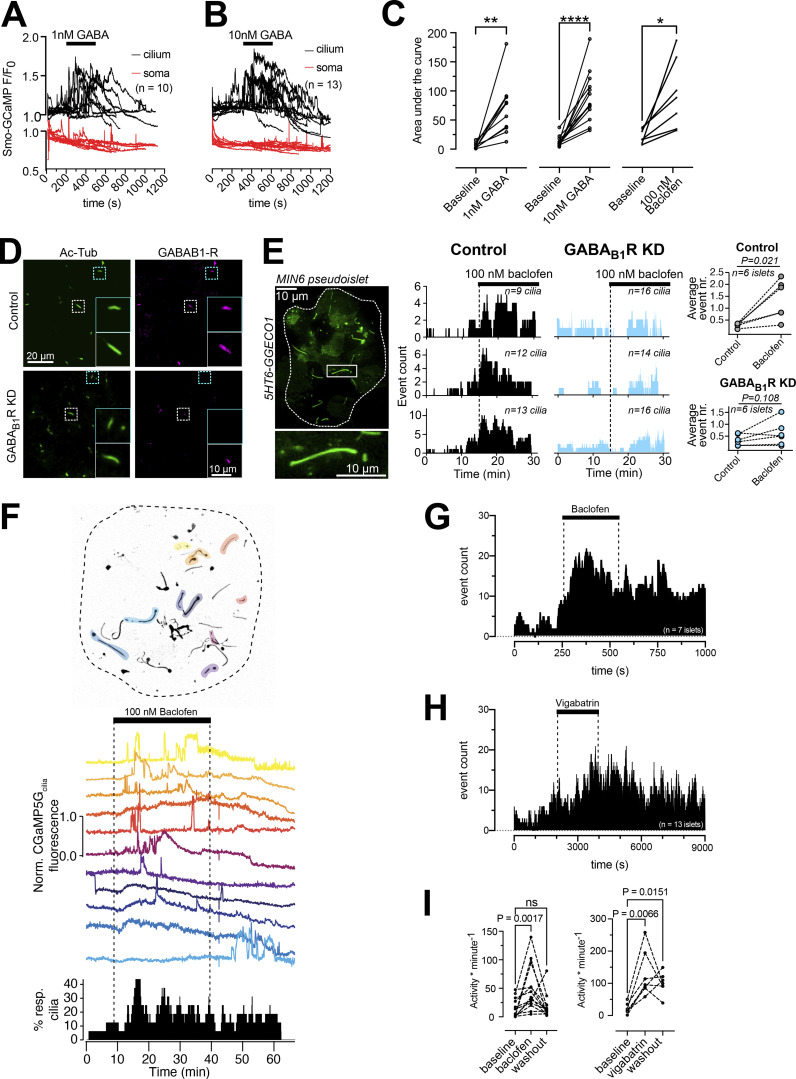
Figure 4.
GABA triggers Ca2+ entry into primary cilia via GABAB1 receptors. (A) TIRF microscopy recordings of GCaMP5G fluorescence in the soma and cilium of MIN6 cells exposed to 1 nM GABA. Notice that the addition of GABA induces a rise of cilia Ca2+ without affecting the Ca2+ concentration in the soma. (B) TIRF microscopy recordings of GCaMP5G fluorescence in the soma and cilium of MIN6 cells exposed to 10 nM GABA. Notice that the addition of GABA induces a rise of cilia Ca2+ without affecting the Ca2+ concentration in the soma. (C) GABA (1 and 10 nM) and the GABAB receptor agonist Baclofen (100 nM) induces increases in the cilia Ca2+ concentration in MIN6 cells (n = 10 cells for 1 nM GABA; n = 13 cells for 10 nM GABA; n = 7 cells for Baclofen; * P < 0.05; ** P < 0.01; **** P < 0.0001; Student’s paired t test). (D) Confocal microscopy immunofluorescence images of control (top) and GABAB1 receptor KD (bottom) MIN6 cell pseudo-islets stained for acetylated tubulin (green) and GABAB1 receptors (magenta). (E) Example TIRF microscopy image of a MIN6 pseudo-islet expressing 5HT6-GGECO (boxed area is magnified below). To the right are shown event counts of all cilia Ca2+ flashes in control (black) and GABAB1 receptor knockdown MIN6 pseudo-islets following addition of baclofen. Each row represents recordings from one control and one GABAB1 receptor knockdown pseudo-islet. Quantifications are shown to the right (n = 6 pseudo-islets for each condition). Statistical significance was assessed using Wilcoxon signed rank test. A TIRF microscopy image of a 5HT6-GGECO1-expressing MIN6 pseudoislet is shown to the left. (F) TIRF microscopy recordings of cilia Ca2+ concentration changes in intact mouse islets expressing Smo-GCaMP5G-mCh. Picture on top shows the distribution of cilia within the islet, with cilia exhibiting at least one spontaneous Ca2+ flash during the recording time highlighted in color. In the middle are shown Ca2+ recordings from the individual cilia within the islet during addition of the GABAB receptor agonist Baclofen. The diagram at the bottom shows the overall cilia Ca2+ activity of the whole islet. (G) Event count of all cilia Ca2+ flashes following the addition of baclofen (n = 7 islets). (H) Event count of all cilia Ca2+ flashes following the addition of vigabatrin (n = 13 islets). (I) Quantifications of the effect of baclofen and vigabatrin on cilia Ca2+ flashes. Statistical significance was assessed using the Friedman test followed by multiple comparisons.

