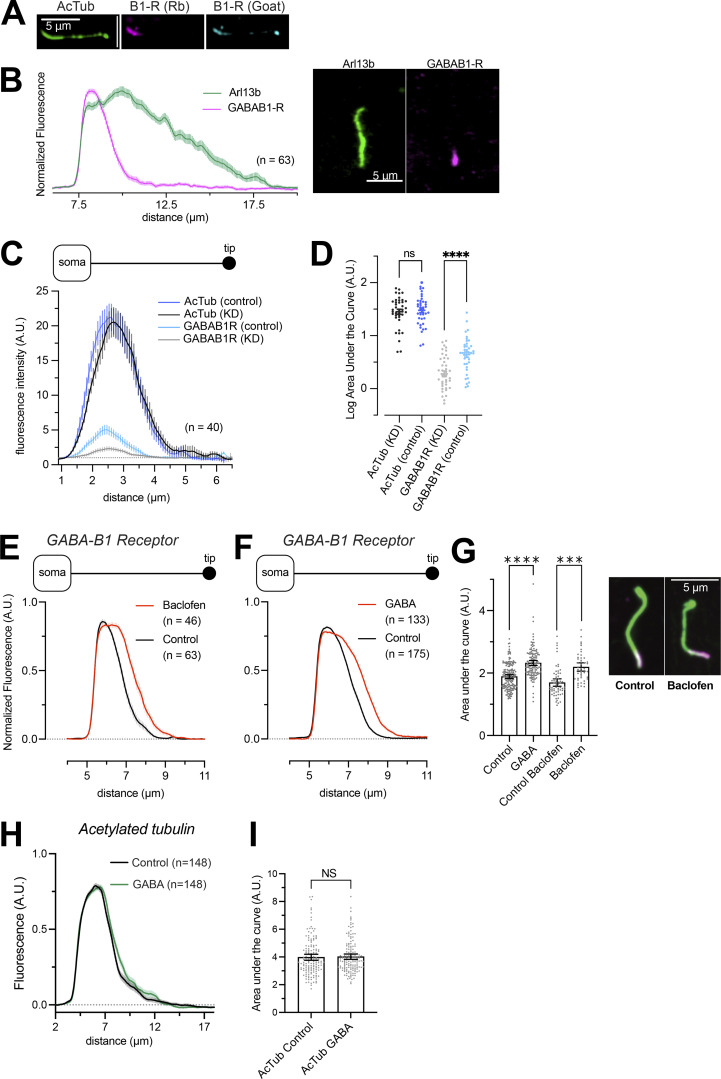
Figure S1.
GABAB1 receptor distribution in the cilium after stimulation. (A) Immnofluorescence staining of a mouse islet cell cilium against acetylated tubulin (green), GABAB1 receptors (Rabbit monoclonal antibody, magenta), and GABAB1 receptors (Goat polyclonal antibody, blue). (B) Quantifications of line profiles drawn along cilia of mouse islet cells immunostained for Arl13b (green) and GABAB1 receptors (magenta). An example cilium is shown to the right. (C) Quantifications of line profiles drawn along cilia of MIN6 cells immunostained for acetylated tubulin and GABAB1 receptors. The two lines are form cells treated for 48 h with control siRNA or siRNA against the GABAB1 receptor (KD). Notice how the GABAB1 immunoreactivity is reduced in cells treated with GABAB1 R siRNA (n = 40 cells from three experiments). (D) Cilia fluorescence intensity from control and GABAB1 receptor KD MIN6 cells immunostained for acetylated tubulin (left) or GABAB1 receptors (right). One-way ANOVA with Šidák’s multiple comparison test (**** P < 0.0001; n = 40). (E) Quantifications of GABAB1 receptor fluorescence intensity and distribution along primary cilia of mouse islet cells under control conditions (black) and following 10-min stimulation with 100 nM of the GABA receptor agonist baclofen (red). Data presented as means ± SEM for the indicated number of cells. (F) Quantifications of GABAB1 receptor fluorescence intensity and distribution along primary cilia of mouse islet cells under control conditions (black) and following 10-min stimulation with 100 nM GABA (red). Data presented as means ± SEM for the indicated number of cells. (G) GABAB1 receptor distribution in mouse islet cilia under control conditions and following stimulation for 10 min with 100 nM GABA or 100 nM Baclofen. Data presented are calculations of the AUC of line profiles drawn along cilia of mouse islet cells immunostained for acetylated tubulin and GABAB1 receptors. Representative images of cilia from a control cell and a cell exposed to baclofen are shown to the right (green, acetylated tubulin; magenta, GABAB1 receptor). Bars show means ± SEM and statistical significance was assessed with ANOVA with multiple comparisons; n = 63 (control) and n = 46 (baclofen); n = 175 (control) and n = 133 (GABA). *** P < 0.001, **** P < 0.0001. (H) Quantifications of acetylated tubulin fluorescence intensity distribution in mouse islet cells under control conditions (black) and following 10-min stimulation with 100 nM GABA (green). Data presented as means ± SEM for 148 cilia from 15 islets and 3 animals. (I) Length distribution of acetylated tubulin in mouse islet cells under control conditions and following stimulation for 10 min with 100 nM GABA. Data presented are calculations of the AUC of line profiles drawn along the acetylated tubulin immunoreactivity (means ± SEM). Two-tailed Student’s unpaired t test; n = 148 (control) and n = 148 (GABA).

