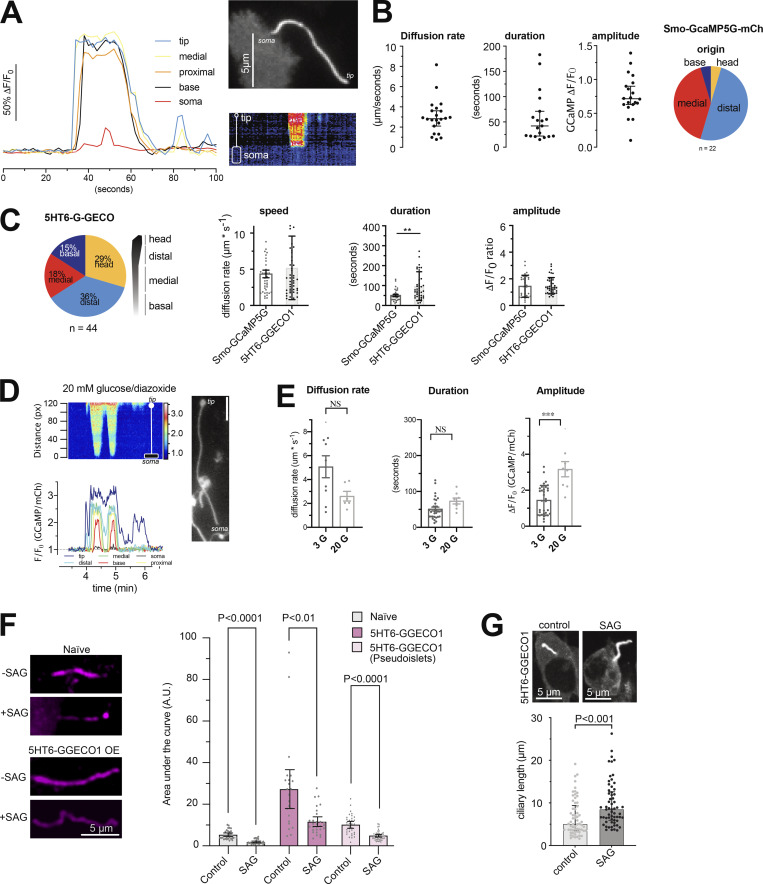
Figure S5.
Characterization of spontaneous Ca2+ flashes in MIN6 cells and mouse islet cells. (A) Spontaneous Ca2+ flash in the primary cilium of a MIN6 cells expressing Smo-GCaMP5G-mCherry. Notice how the flash originates in the tip of the cilium and propagates toward the base and how this coincides with a small local rise of Ca2+ in the cilia-adjacent cytosol. (B) Characteristics of cilia Ca2+ flash diffusion rate, duration, amplitude, and site of origin in MIN6 cells expressing Smo-GCaMP5G-mCh (means ± SEM; n = 22 cilia). (C) Characteristics of cilia Ca2+ flashes detected with the Ca2+ sensor 5HT6-G-GECO1. Pie chart shows the origin of Ca2+ influx and the bar graphs show the diffusion rate, duration of the events, and amplitude of the response compared to Smo-GCaMP5G-mCh (means ± SEM; n = 24–42 cells). Statistical significance was determined using a two-tailed unpaired Student’s t test (** P < 0.01). (D) A spontaneous Ca2+ flash in a mouse islet cell expressing Smo-GCaMP5G-mCh and kept in a buffer containing 20 mM glucose and 250 μM diazoxide. Notice how the wave propagates from tip to base and how the strength of the flash is diminished as it approaches the base. (E) Characteristics of cilia Ca2+ flash diffusion rate, duration, and amplitude in mouse islet cells expressing Smo-GCaMP5G-mCh and kept in 3 mM glucose or 20 mM glucose supplemented with diazoxide. Statistical significance was determined using a two-tailed unpaired Student’s t test (*** P < 0.001). Diffusion rate: 3G n = 37 cells from 30 islets; 20G n = 6 cells from 4 islets. Duration: 3G n = 31 cells from 30 islets; 20G n = 8 cells from 4 islets. Amplitude: 3G n = 33 cells from 30 islets; 20G n = 8 cells from 4 islets (means ± SEM). (F) Quantification of immunofluorescence images of mouse islets and MIN6 pseudoislets stained for the cilia receptor Patched under control conditions and following 24 h stimulation with SAG (100 nM). Bar graphs in gray represent naive islets and in magenta islets or pseudoislets transduced with a viral vector encoding the cilia localized Ca2+ sensor 5HT6-GGECO1. Statistical significance was assessed with Brown-Forsythe and Welch one way ANOVA (means ± SEM; n = 29, 27, 23, 29, 34, and 48). (G) Measurements of cilia length in MIN6 cells expressing 5HT6-GGECO treated for 24 h with solvent (control) or 1 µM SAG (means ± SEM; n = 61 cilia for control and 64 cilia for SAG; statistical significance assessed with Kolmogorov-Smirnov test).

