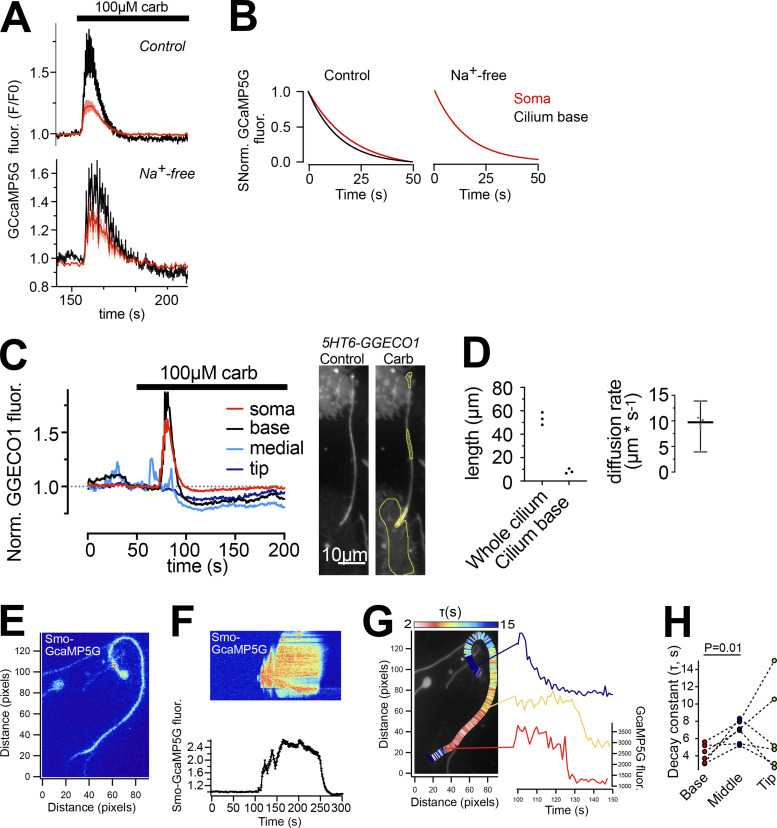
Figure S6.
Carbachol-induced changes in cilia Ca2+. (A) Ca2+ recordings from mouse islet cell cilia (black) and soma (red) expressing Smo-GCaMP5G-mCh following exposure to 100 µM carbachol in normal or Na+-free extracellular medium (means ± SEM for 18 cells from 9 islets from 5 animals, control; 12 cells, 4 islets, 2 animals). (B) Curve fittings of the Ca2+ decay in soma and cilia under normal and Na+-free conditions. (C) Ca2+ recordings from a mouse islet cilium and soma expressing 5HT6-G-GECO1 during stimulation with 100 µM carbachol. Images to the right show the G-GECO1 fluorescence before and during application of carbachol. (D) Quantifications (means ± SD) of cilia length and the length of the ciliary compartment where carbachol elicited a rise of Ca2+. To the right is Ca2+ diffusion rates determined in cilia expressing 5HT6-G-GECO1. (E) TIRF micrograph of an islet cell cilium expressing Smo-GCaMP5G-mCherry. (F) Normalized kymograph from (top), and average Smo-GCaMP5G-mCherry fluorescence change in (bottom), the cilium in E during a spontaneous Ca2+ flash. (G) The same cilium as in E that has been pseudo-colored to illustrate the rate of Ca2+ extrusion during the declining phase of the spontaneous Ca2+ flash. The colors show the tau values (rates) for each pixel-wide segment of the entire cilia length, where white/red represents the fastest rate and blue represents the slowest rate. Individual intensiometric traces of 5HT6-GGECO1 fluorescence change from three distinct segments of the cilium (base, middle, and tip) are shown to the left. Notice that the rate of extrusion is fastest at the cilia base. (H) Rate of Ca2+ decay in three cilia segments (base, middle [40 pixels from base], and tip). Each point corresponds to one cilium and lines indicate individual cilium.(n = 6 cilia, two-tailed paired Student’s t test.

