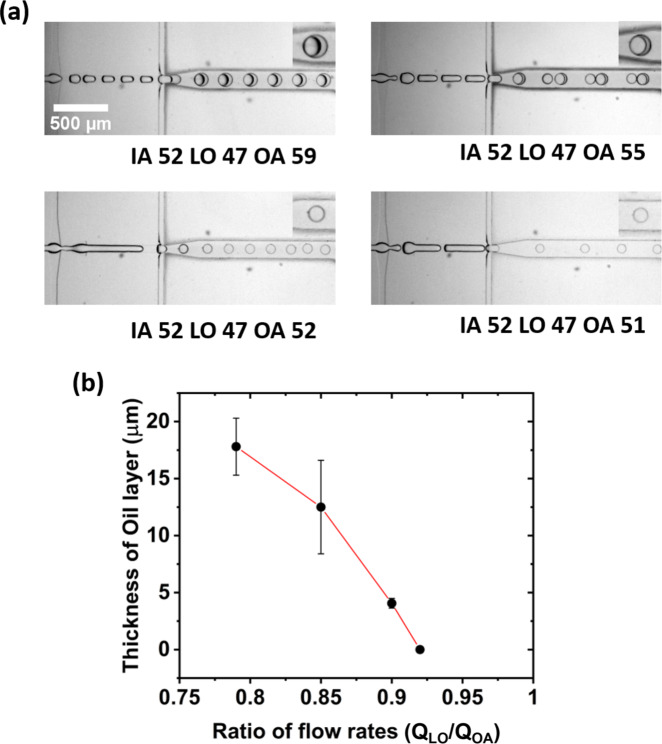
Fig. 3. Manipulation of pressure-induced flow rates for reduced oil content and ultra-thin shells.
a High-speed camera images of the microfluidic liposomal production process to reduce the oil thickness. Inserts: enlarged images of individual double emulsions. From the top left to the bottom right corner, the oil thickness has been reduced by gradually tuning the flow rates of the OA (outer aqueous solution). Pressures for each channel are given in mbar. b Plot showing the thickness of the oil layer that is reduced from 17 ± 2 to 12 ± 4 µm, 4 ± 0.5 µm and finally to optically non-detectable amounts by changing the flow rate (Q) ratios. Error bars are taken from the standard deviation of the mean (n > 15).

