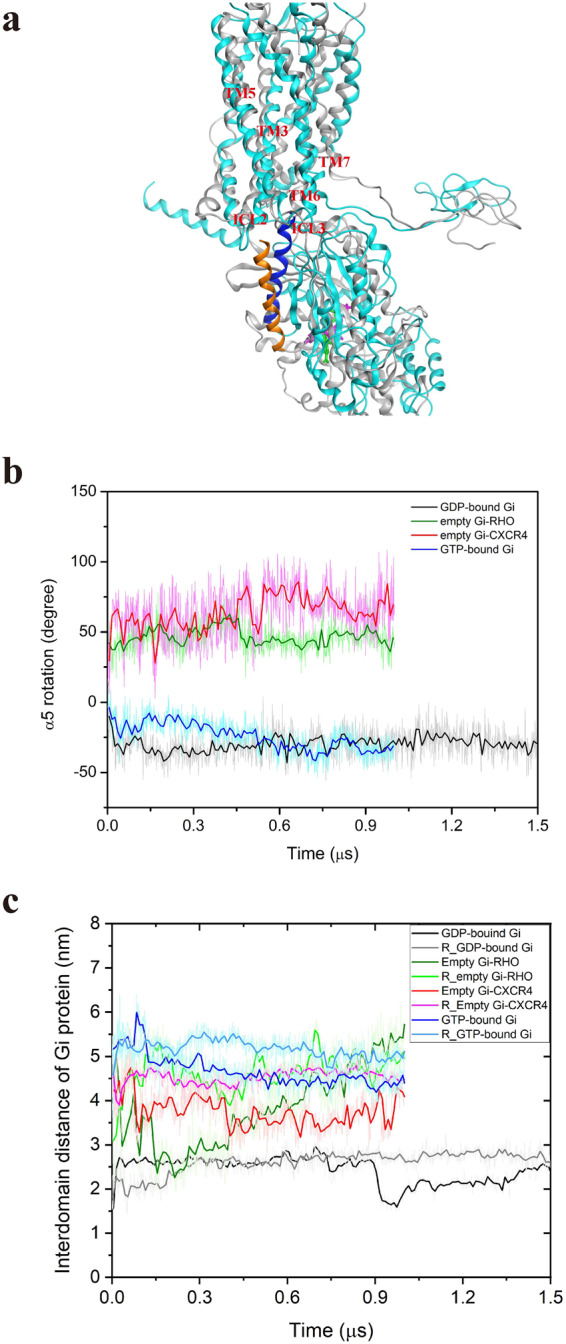
Fig. 5. Conformational changes of Gαi-protein induced by Gαi-protein associated with the CXCL12-bound CXCR4 during the MD simulations.

a Superposition of CXCL12–CXCR4–GDP-bound Gαi tricomplex at the initial and final simulation phases. The complex structures are represented as ribbons, with gray color for initial time and cyan color for final time. For the initial time, α5-helix is colored orange, and GDP is represented as a green stick. For the final time, α5-helix is colored blue, and GDP is represented as a purple stick. b The rotation of the α5-helix of Gαi-protein with time at various Gαi-protein states. c The interdomain distance of Gαi-protein with time at diverse Gαi-protein states. For b and c, GDP-Gαi-bound CXCR4, empty Gαi-bound rhodopsin (RHO), empty (nucleotide-free) Gαi-bound CXCR4, and GTP-Gαi-bound CXCR4, are marked using black, green, red, and blue lines, respectively. The replicate simulations were shown as light colors.
