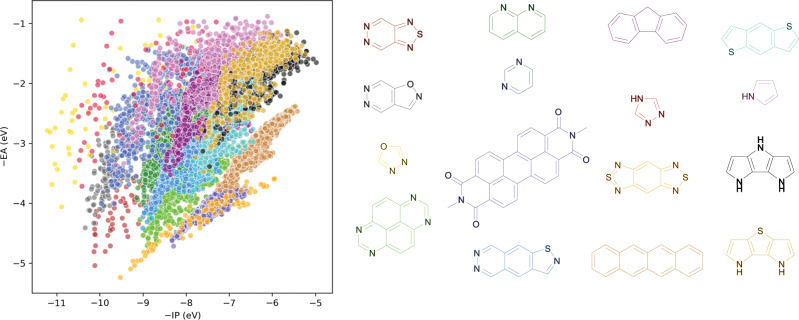
Fig. 7. Topographical analysis of molecular skeletons.
The −IP vs. −EA property space is divided into equal sub-spaces defined by increments of −IP and −EA (Supplementary Table 2). For each sub-space, we identify the most prevalent molecular skeleton—normalised by its frequency in the total dataset—and plot all substituted molecules containing that skeleton. The prevalent skeletons are shown in colour and the −IP/−EA values of the corresponding substituted molecules are shown in the same colour.

