
Figure 2.
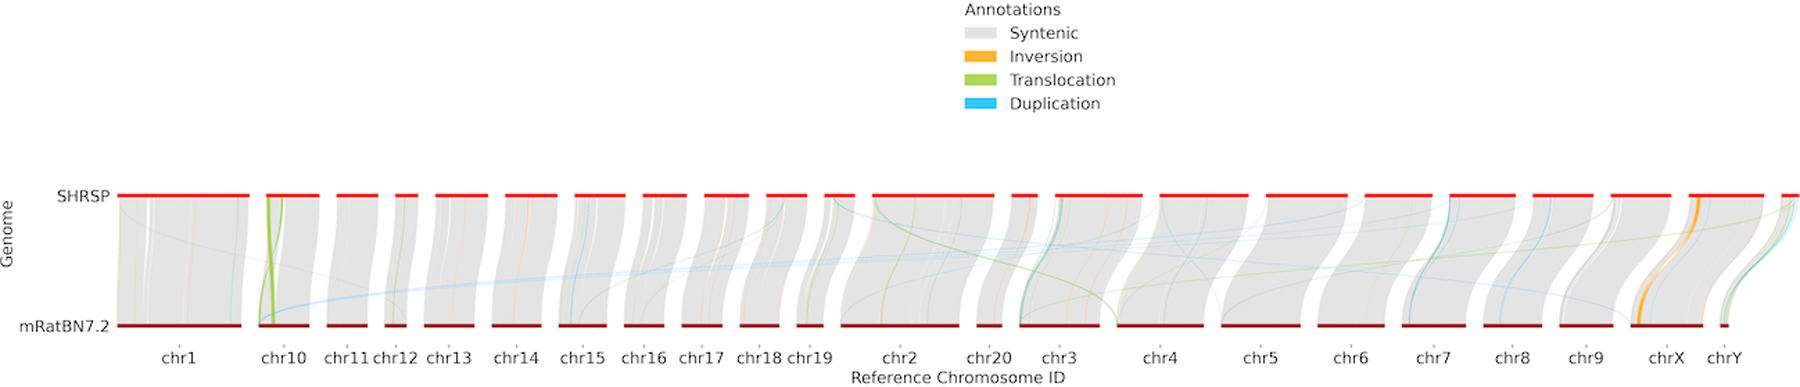
Synteny and Rearrangement plot of the current rat reference (mRatBN7.2) compared with the SHRSP genome assembly. This plot reveals both within and across chromosome re-arrangements.
Official websites use .gov
A
.gov website belongs to an official
government organization in the United States.
Secure .gov websites use HTTPS
A lock (
) or https:// means you've safely
connected to the .gov website. Share sensitive
information only on official, secure websites.
Synteny and Rearrangement plot of the current rat reference (mRatBN7.2) compared with the SHRSP genome assembly. This plot reveals both within and across chromosome re-arrangements.