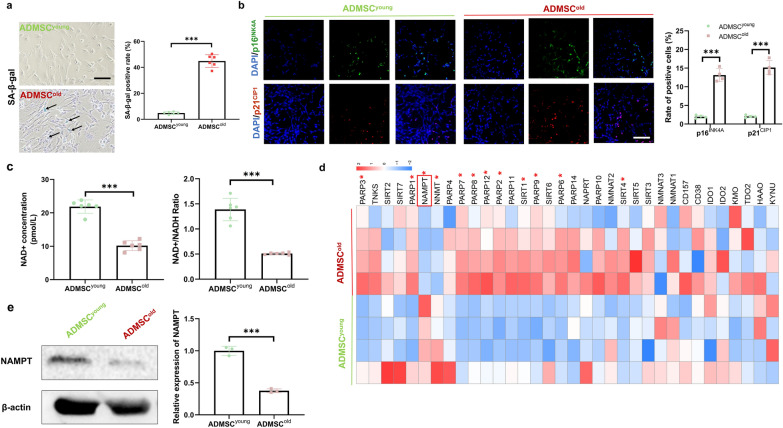
Fig. 2.
ADMSCold demonstrated significant cellular senescence and impaired NAD+ metabolism. a SA-β-gal activity and the percentages of SA-β-gal-positive cells in ADMSCyoung and ADMSCold. Scale bar = 200 μm, n = 6. b Immunofluorescence staining of p16INK4A (green), p21CIP1 (red) and nuclear (DAPI, blue) in cultured ADMSCyoung and ADMSCold. Scale bar = 200 μm. Quantification of the relative rate of positive cells was performed, n = 6. c NAD+ concentrations and NAD+/NADH ratios in ADMSCyoung and ADMSCold, n = 6. d The relative expression of NAD+ metabolism-related genes by RT‒PCR in ADMSCyoung and ADMSCold and their expression patterns were visualized by a heatmap. Low expression is marked in blue, and high expression is marked in red. Red * indicates significantly different genes, n = 3. The red box highlights the target gene NAMPT, which was used in an advanced study. (e) Western blot analysis and quantification of the expression of NAMPT proteins in ADMSCyoung and ADMSCold, n = 3. Data are presented as the mean ± SD (***: P < 0.001)

