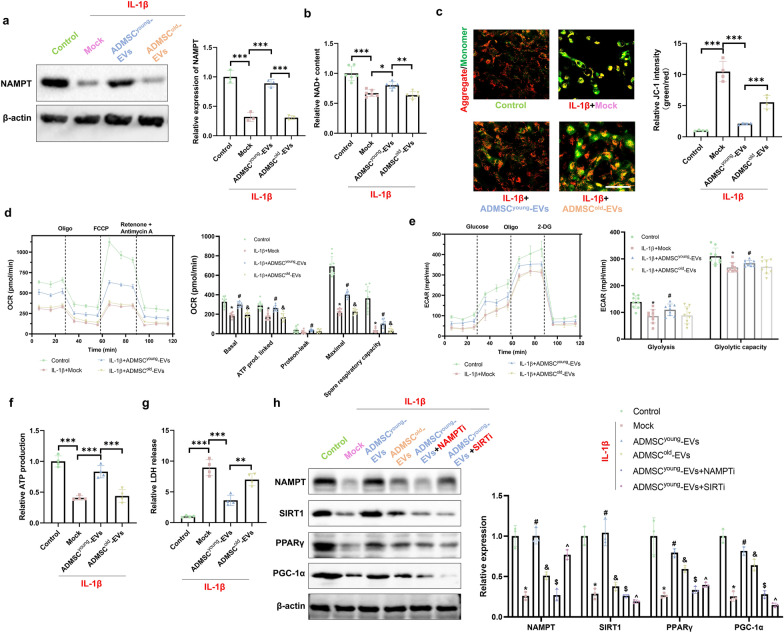
Fig. 7.
ADMSCyoung-EVs protected tenocytes treated with IL-1β by restoring NAD + biosynthesis and the NAMPT/SIRT1/PPARγ/PGC-1α pathway. a Western blotting and quantification of NAMPT in the control, IL-1β, IL-1β + ADMSCyoung-EV and IL-1β + ADMSCold-EV tenocyte groups, n = 3. b Relative NAD+ content in the control, IL-1β, IL-1β + ADMSCyoung-EV and IL-1β + ADMSCold-EV tenocyte groups, n = 4. c JC-1 staining of tenocytes in the control, IL-1β, IL-1β + ADMSCyoung-EVs and IL-1β + ADMSCold-EV groups. Aggregates are shown in red, and monomers are shown in green. The relative JC-1 intensity was quantified, and n = 4. Scale bar = 200 μm. d OCR curves and OCR respiratory reactions in the control, IL-1β, IL-1β + ADMSCyoung-EV and IL-1β + ADMSCold-EV tenocyte groups. The basal OCR, ATP production, protein leak, maximal OCR, and spare respiratory capacity were calculated, n = 4. e The ECAR curves and ECAR respiratory reactions in the control, IL-1β, IL-1β + ADMSCyoung-EV and IL-1β + ADMSCold-EV tenocyte groups, n = 4. The gliosis and glycolytic capacity were calculated. f The relative ATP production ability in the control, IL-1β, IL-1β + ADMSCyoung-EV and IL-1β + ADMSCold-EV tenocyte groups, n = 4. g Relative LDH release in the control, IL-1β, IL-1β + ADMSCyoung-EV and IL-1β + ADMSCold-EV tenocyte groups, n = 4. h Western blotting and quantification of NAMPT, SIRT1, PPARγ and PGC-1α in the control, IL-1β, IL-1β + ADMSCyoung-EVs, IL-1β + ADMSCold-EVs, IL-1β + ADMSCyoung-EVs + NAMPT inhibitor and IL-1β + ADMSCyoung-EVs + SIRT1 inhibitor tenocyte groups, n = 3. (*: control vs. IL-1β treatment; #: IL-1β treatment vs. IL-1β + ADMSCyoung-EVs treatment; &: IL-1β + ADMSCyoung-EVs vs. IL-1β + ADMSCold-EVs treatment groups, $: IL-1β + ADMSCyoung-EVs vs. IL-1β + ADMSCyoung-EVs + NAMPT inhibitor; ^: IL-1β + ADMSCyoung-EVs vs. IL-1β + ADMSCyoung-EVs + SIRT1 inhibitor, P < 0.05; **: P < 0.01; ***: P < 0.001)

