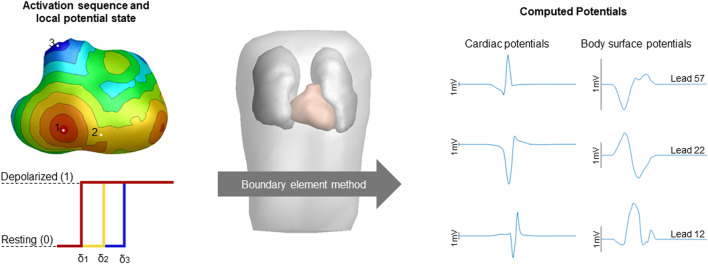
FIGURE 1.
Schematic overview of the computation of potentials. The simulated activation sequences, constructed transmembrane potentials and the boundary element method compute the volume conductor effect to compute cardiac and body surface potentials. Activation timing is displayed from red (early) to blue (late), corresponding local potential states were displayed for three sites of interest with the color of the displayed potential corresponding to the local activation timing with δ denoting local activation timing. Computed cardiac and body surface potentials were displayed with the height of the black bar indicating 1 mV. The displayed body surface potentials are taken from the 64-lead setup, specifically lead 12 positioned two intercostal spaces above V1, lead 22 positioned at the lower sternum and lead 57 positioned at the right side of the back are displayed.

