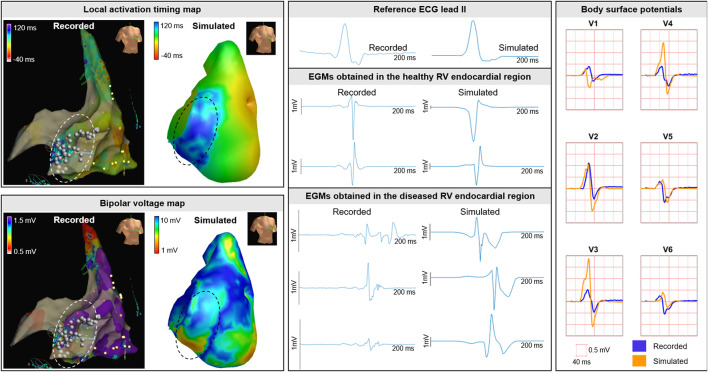
FIGURE 10.
Clinical EAM case. Recorded and simulated electro-anatomical mapping (EAM). Local activation timing and bipolar voltage maps of the RV endocardium are displayed from red (early/low) to blue (late/high). Recorded and simulated bipolar cardiac electrograms are displayed for healthy and diseased regions. Within diseased regions (dashed circles), fragmentation and late potentials occur in recorded and simulated electrograms. Ablation was performed and indicated with the white dots. Recorded and simulated body surface potentials. The BSP is displayed per lead for the QRS complex for the precordial signals V1-V6 from the standard 12-lead ECG. One cube in the 12-lead ECG corresponds to 40 ms (width) and 0.5 mV (height).

