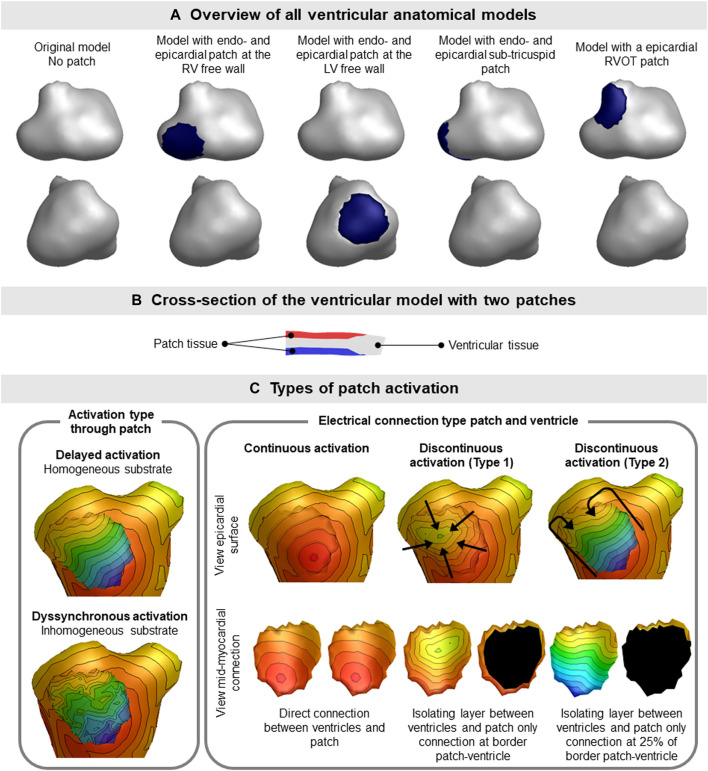
FIGURE 2.
Ventricular patch model overview and simulation characteristics. (A) The four different patch locations used for the simulation studies are displayed. The location of the patch is indicated by the blue region on the epicardium. Where indicated with endo- and epicardial patch, an opposing endocardial is present with the same size as the displayed epicardial patch. (B) Patches (red, endocardial and blue, epicardial) were embedded within the ventricular tissue (gray), thereby not changing the outer shape of the ventricular model. (C) Different types of activation sequences (delayed, dyssynchronous, continuous and discontinuous) of the patches are displayed as local activation timing maps from red (early) to blue (late) with isochrone steps of 10 ms. The isolating layer between the ventricles and patch is indicated in black on the inside of the patch. The ventricular activation sequence of the myocardium (excluding the patch) used in this study was equal for all models.

