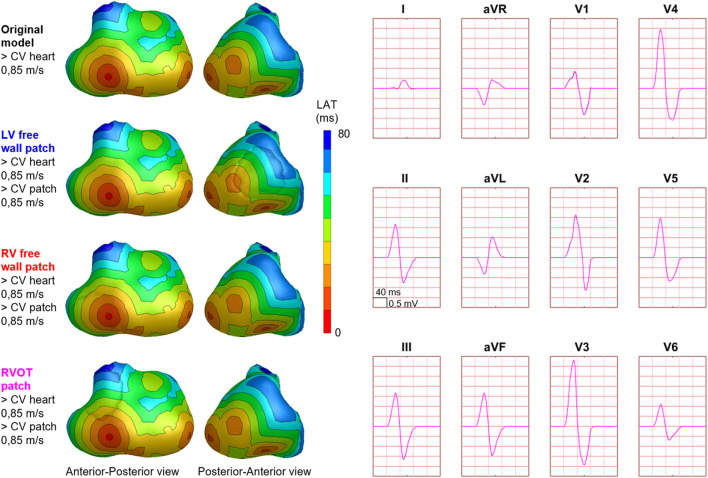
FIGURE 3.
Effect of patch incorporation within the ventricular model. For both the original model and three of the models with patch, normal ventricular and patch activation were computed. Activation sequences were displayed from red (early) to blue (late). All simulated BSP signals overlap, as can be observed in the presented standard 12-leed ECG. One cube in the 12-lead ECG corresponds to 40 ms (width) and 0.5 mV (height) as also indicated in lead II.

