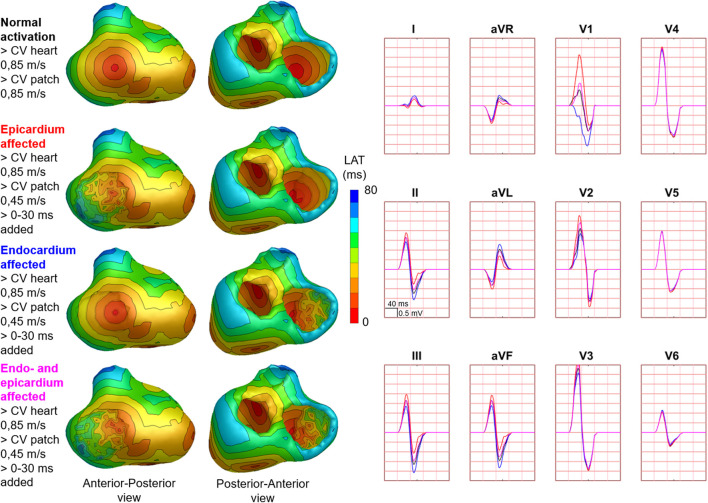
FIGURE 7.
Effect of endocardial vs. epicardial disease on body surface potentials. Representative example of the effect of diseased endocardial and/or epicardial patch activation on body surface potentials. Activation sequences of the patches and ventricles are displayed from red (early) to blue (late) with isochrone steps of 10 ms. All simulated BSP are displayed in the simulated 12-lead ECG. The colors in the ECG correspond to the colors stated in the left column with the simulation characteristics. With endocardial vs. epicardial patch location, the effect in leads with maximum effect was opposed. One cube in the 12-lead ECG corresponds to 40 ms (width) and 0.5 mV (height) as also indicated in lead II.

