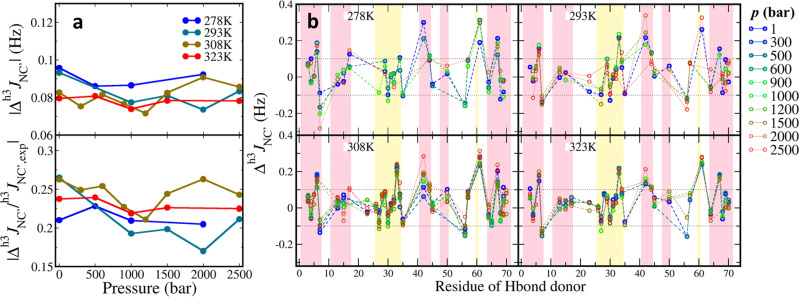
Fig. 3. The discrepancy of calculated h3JNC′ coupling from the experiments.
a The absolute average h3JNC′ difference of each system. The upper panel shows the average of absolute difference and the lower panel shows the ratio of absolute difference over experimental value. b The residue-wise Δh3JNC′ of all systems. Each panel organizes the Δh3JNC′ of different pressures in a specific temperature. The hydrogen bonds are indexed by the donor residue. The panel background is colored by the secondary structure domains, i.e., yellow for helices and pink for sheets. The dotted baselines indicate the thresholds ±0.1 Hz.

