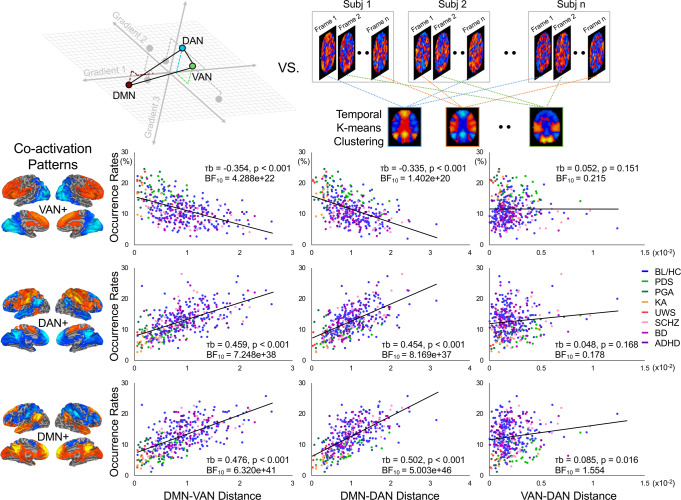
Fig. 6. Correlation between-network distance and occurrence rates of co-activation patterns.
Pair-wise network distance was calculated among ventral attention/salience network (VAN), dorsal attention network (DAN), and default-mode network (DMN). Co-activation analysis was applied to calculate their occurrence rates, namely VAN+, DAN+, and DMN+. Bayesian Kendall Correlations were performed between-network distance (DMN-VAN, DMN-DAN, and VAN-DAN) and occurrence rates (VAN+, DAN+, and DMN+) across all participants and conditions (n = 393). Kendall’s tau-b (τb), FDR-corrected p values (at α = 0.05), and BF10 are reported in each scatter plot. A smaller network distance of DMN-VAN and DMN-DAN was associated with a suppression of occurrence in DMN+ and DAN+, with an increased probability of the occurrence in VAN+. BL/HC conscious baseline and healthy controls, PDS propofol deep sedation, PGA propofol general anesthesia, KA ketamine anesthesia, UWS unresponsive wakefulness syndrome, SCHZ schizophrenia, BD bipolar disorder, ADHD attention deficit hyperactivity disorder. Source data are provided as a Source Data file.

