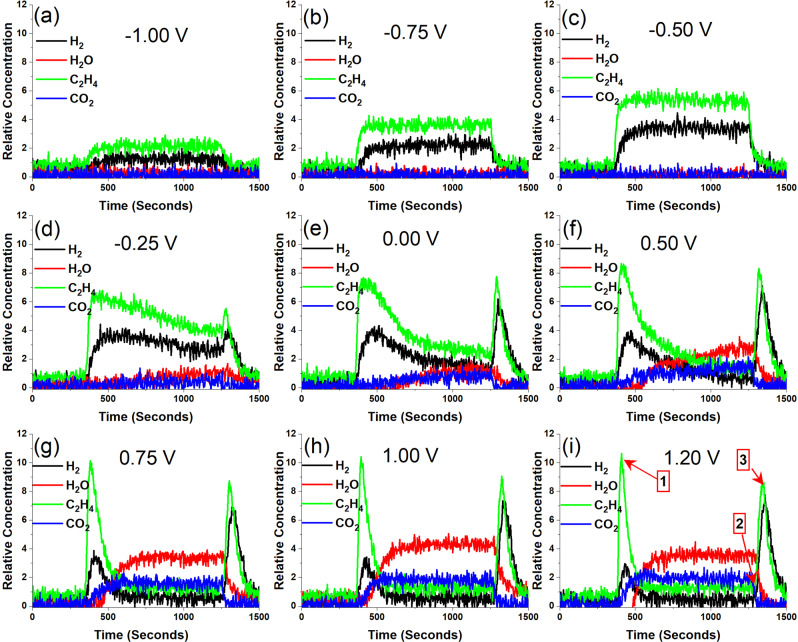
Fig. 2. Mass spectroscopic analysis of outlet stream under chronoamperometric measurements.
Mass spectroscopic analysis of the outlet gas stream during chronoamperometric measurements observed under various bias potentials with respect to the reference electrode: a −1.00 V, b −0.75 V, c −0.50 V, d −0.25 V, e 0.00 V, f 0.50 V, g 0.75 V, h 1.00 V, and i 1.20 V. The black and red curves indicate H2 and H2O, while green and blue curves indicate C2H4 and CO2, respectively.

