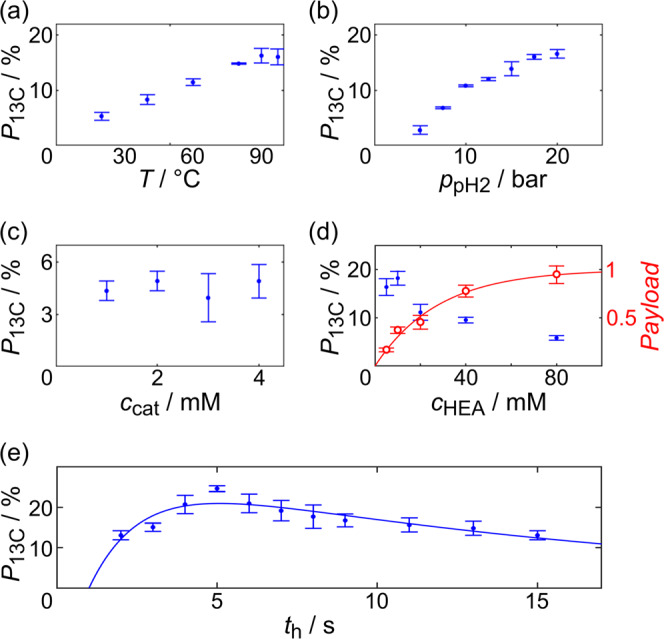
Fig. 3. Optimization of rapid PHIP.

13C hyperpolarization P13C of HEP (blue dots) as a function of temperature T (a), parahydrogen pressure ppH2 (b, T = 90 °C), concentration of catalyst ccat (c, cHEA = 80 mM), precursor cHEA (d), and hydrogenation time th (e, cHEA = 5 mM). In (d), the payload (cHEA ∙ P13C; normalized; red circles) is also shown with errors calculated from errors of P13C(cHEA) using Gaussian error propagation. Fitted curves correspond to a mono-exponential saturation function (d; R2 = 0.98) and the hydrogenation kinetics model from the main text (e; R2 = 0.7). Unless stated otherwise, parameters were T = 80 °C, ppH2 = 15 bar, ccat = 2 mM, cHEA = 20 mM, th = 5 s, and the mean and standard error of N = 3 experiments is reported; P13C was quantified assuming hydrogenation of the full amount of precursor was completed. Data is reported in Supplementary Table 3. Data in (c) and (e) were published before but add to the matter at hand36,56.
