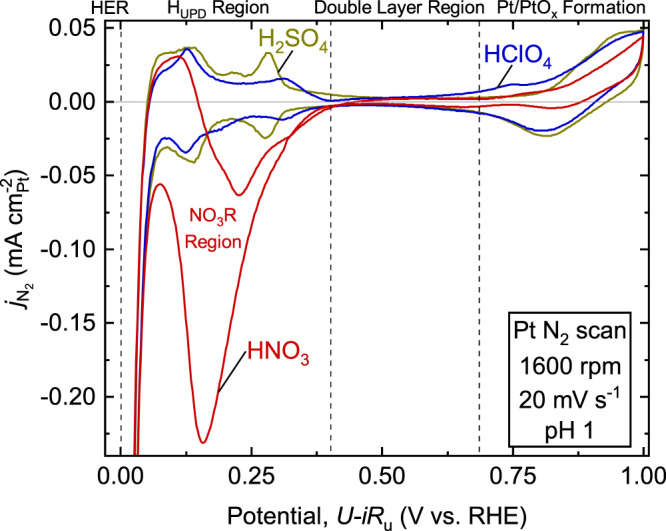
Fig. 1. Characteristic Pt cyclic voltammogram in N2-saturated HClO4, H2SO4, and HNO3.

Representative cyclic voltammogram (CV) of the Pt disk at 20 mV s–1 in N2-sat’ed HClO4, H2SO4, and HNO3. Dashed regions indicate approximate divisions of potential ranges as indicated along the top: hydrogen evolution reaction (HER) region, hydrogen under-potential deposition (HUPD) region, double layer capacitance region, and surface Pt oxidation/PtOx reduction region. Color code: HClO4 (blue), HNO3 (red), and H2SO4 (olive).
