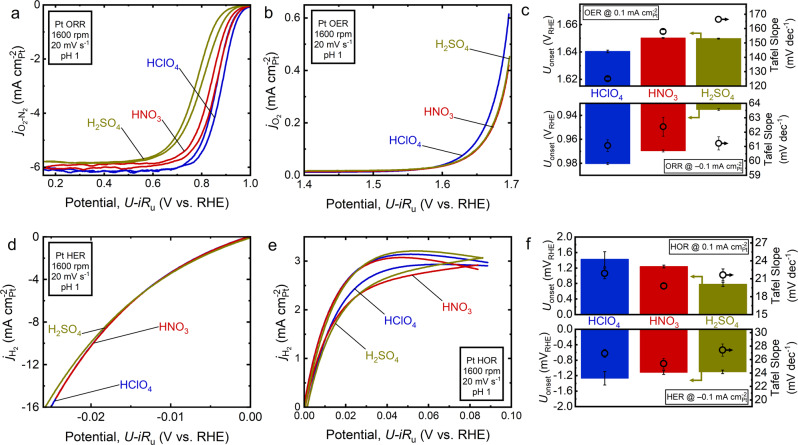
Fig. 2. Evaluation of Pt for oxygen and hydrogen electrocatalysis in HClO4, HNO3, and H2SO4.
a Representative third-cycle-averaged N2-subtracted oxygen reduction reaction (ORR) rotating disk electrode (RDE) cyclic voltammogram (CV) of the Pt disk in pH 1 HClO4, HNO3, and H2SO4. b Representative second-cycle-averaged oxygen evolution reaction (OER) RDE CV of the Pt disk in pH 1 HClO4, HNO3, and H2SO4 (OER trend is consistent as a function of cycle, Supplementary Fig. 4). c Average OER (top) and ORR (bottom) onset potential (bars, left y-axis) 0.1 mA for all three acids and average Tafel slope (circles, right y-axis) in the low current density region. d Representative third-cycle-averaged hydrogen evolution rection (HER) RDE CV of the Pt disk in pH 1 HClO4, HNO3, and H2SO4. e Representative third-cycle-averaged hydrogen oxidation reaction (HOR) RDE CV of the Pt disk in pH 1 HClO4, HNO3, and H2SO4. f Average HOR (top) and HER (bottom) onset potential (bars, left y-axis)0.1 mA for all three acids and average Tafel slope (circles, right y-axis) in the low current density region. Error bars represent the standard deviation of separate triplicate measurements. All CVs collected at 1600 rpm, 20 mV s–1, and iRu corrected. Color code: HClO4 (blue), HNO3 (red), and H2SO4 (olive).

