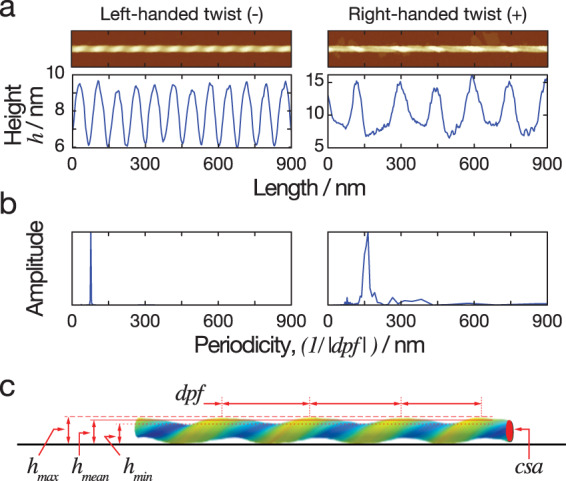
Fig. 5. Nano-morphometry on individual fibrils results in quantitative structural parameters.

a Two example images of straightened fibrils, including a left-hand twisted fibril and a right-hand twisted fibril, are shown together with their corresponding height profiles across the centre line of each straightened fibril. The minimum, maximum and average heights can be determined directly from the height profiles. b FFT of the height profiles are shown, with peaks represent the periodicity describing the repeating units in the height profile. The average length covered by the repeating unit, representing the periodicity of the fibrils, was extracted from this analysis. Because the two example fibrils have different twist handedness, the directional periodic frequency (dpf) was assigned as a negative value for left-hand and a positive value for right-hand twisted fibrils. c A schematic diagram illustrating the quantitative structural parameters obtained from each individual fibril. The solid black line at the bottom representing the mica surface during AFM imaging. The parameters measured include the average height (hmean), the minimum height (hmin), the maximum height (hmax), the directional periodic frequency (dpf), and the cross-sectional area (csa).
