
Fig. 4. Atomic mean square displacements.
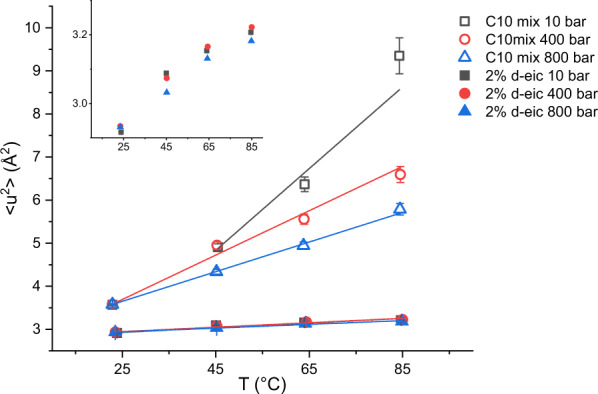
MSD for the two samples studied: C10 mix (empty symbols) and C10 mix with d-eicosane (full symbols). All lines are linear fits to the data. Note the clear dependence on temperature and pressure for the sample missing the eicosane, while all MSD values vary little at all T–p when the eicosane is added. The errors are calculated by propagation from Isum, as detailed in the main text. Inset: vertical zoom of the C10 mix + 2% d-eicosane data.