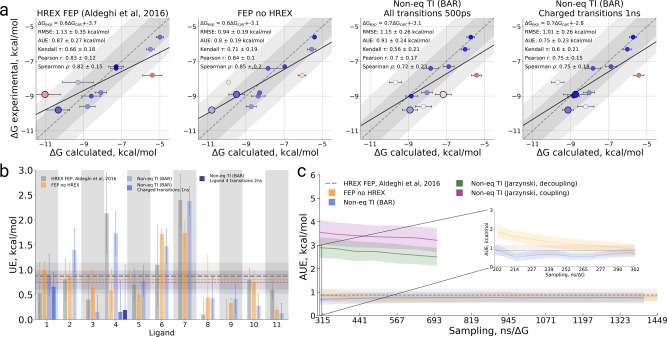
Fig. 3. Binding free energy calculation summary for the BRD4(1) specificity study.
a Calculated vs experimental ΔG values for the HREX FEP7, FEP without sampling enhancement, and non-equilibrium TI approaches. Two versions of the latter method are depicted: all transitions of 500 ps and extended 1 ns transitions for the charged ligands (Ligand 1 and Ligand 4). The larger circles in every panel denote Ligand 1 and Ligand 4. In the panels we also provide a linear regression fit as well as RMSE, AUE, Kendall, Pearson, and Spearman correlations. b Unsigned error (UE) by ligand for each of the considered protocols. c Average unsigned error (AUE) with respect to experimental measurement for varying sampling time invested in each of the approaches studied. The time reflects only the sampling invested in the protein–ligand coupling part of the calculation. The dashed line for HREX FEP7 marks the accuracy of the estimate using the whole available sampling, i.e., it does not depict dependence on the sampling time. The inset shows the behavior of AUE for FEP and bi-directional non-equilibrium TI when less than 10% of the sampling production time is considered for the ΔG estimation. The uncertainties denote standard errors obtained by bootstrapping.

