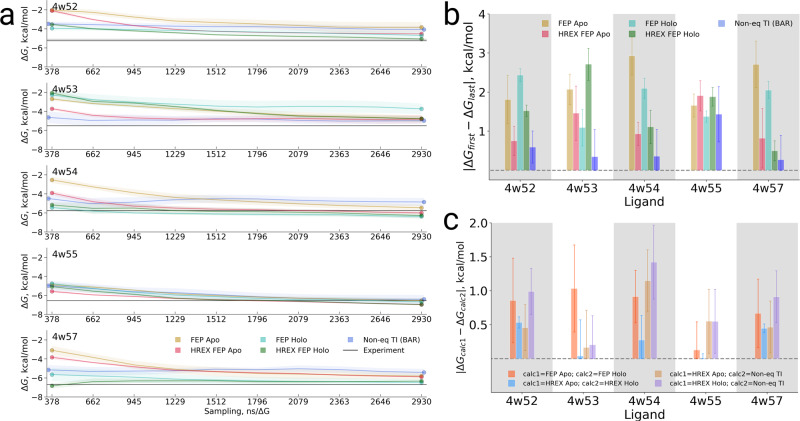
Fig. 7. Free energy calculations of the ligands binding to T4 lysozyme (L99A).
a Free energy values calculated with different methods plotted against the sampling time. The time reflects only the sampling invested in the protein–ligand coupling part. b Absolute differences between the first free energy evaluation (cumulatively using approximately 380 ns for each method in the protein–ligand coupling part) and the last free energy evaluation (~2900 ns per method). c Absolute difference between the calculated free energy (final value, ~2900 ns per method) between several selected methods. The uncertainties denote standard errors obtained by bootstrapping.

