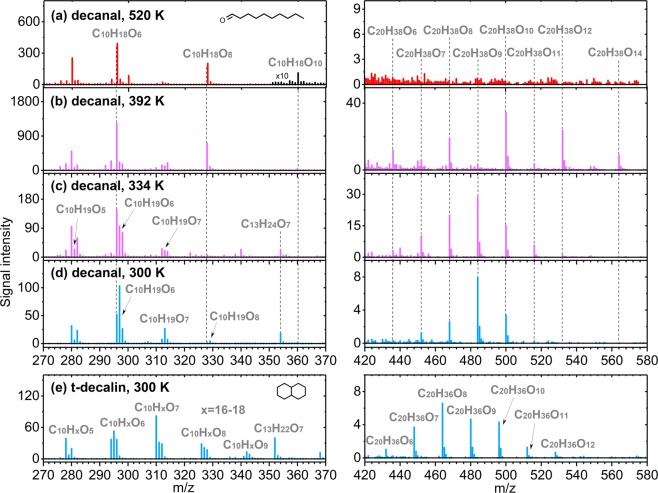
Fig. 2. Product species distribution from the autoxidation of VOCs as measured by mass spectrometry.
The mass spectra for decanal are in (a–d) and the mass spectrum for trans-decalin is in (e). The left and right panels cover the mass ranges of monomer and ROOR accretion products, respectively. TME + O3 reactions were used to produce OH radicals needed to initiate VOC oxidation in all experiments, except at T = 520 K, where oxidation was initiated by O2. C13 products result from accretion between TME derived C3_RO2 and decalin/decanal derived C10_RO2. Spectra in a–c were measured from the JSR, d–e from the Helsinki flow reactor.

