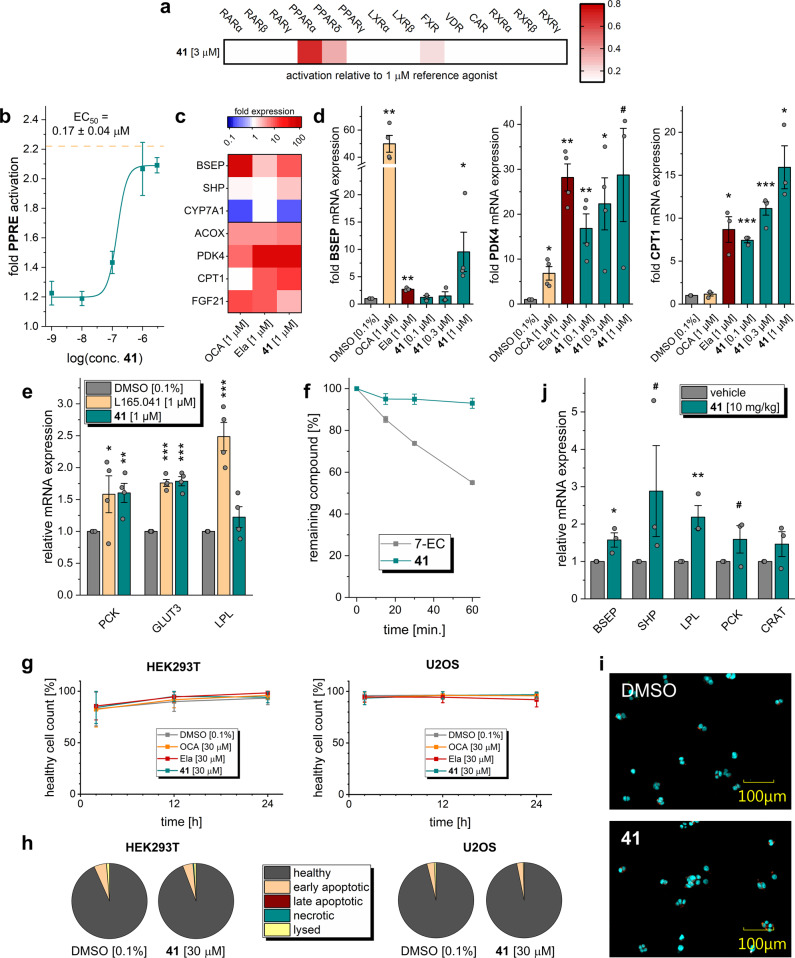
Fig. 6. In vitro and pilot in vivo profiling of 41.
a 41 displayed high selectivity over nuclear receptors related to PPARs and FXR. Heatmap shows mean relative nuclear receptor activation of three independent experiments. b 41 activated a full-length human PPAR response element (PPRE) reporter in HEK293T cells with equal potency as observed in the Gal4 hybrid setting. The dashed line corresponds to the activation of reference agonist L165,041 (1 μM). Results are the mean ± SEM, n = 3. c 41 (1 µM) modulated mRNA expression of FXR-regulated (BSEP, SHP, and CYP7A1) and PPAR-regulated (ACOX, PDK4, CPT1, FGF21) genes in HepG2 cells thereby fusing the activities of obeticholic acid (OCA) and elafibranor (Ela). Heatmap shows mean fold mRNA induction compared to vehicle-treated cells, n = 4. Individual genes are shown in d and Supplementary Fig. 4. d 41 induced expression of FXR-regulated BSEP, PPARδ-regulated PDK4, and PPARα-regulated CPT1 in a dose-dependent fashion. Results are mean ± SEM fold mRNA expression compared to vehicle-treated cells, n = 3. ***p < 0.001, **p < 0.01, *p < 0.05, #p < 0.1 (t test vs. DMSO-treated cells). e 41 stimulated mRNA expression of PPARδ-regulated genes PCK, GLUT3, and LPL in C2C12 cells (reference L165,041). Results are mean ± SEM fold mRNA expression compared to vehicle-treated cells, n = 4. ***p < 0.001, **p < 0.01, *p < 0.05 (t test vs. DMSO-treated cells). f 41 was very stable against microsomal degradation. 7-Ethoxycoumarin (7-EC) for comparison. Results are the mean ± SEM, n = 3. g Healthy cell count [%] after 2, 12, and 24 h of 30 µM compound exposure (41, obeticholic acid, elafibranor) or 0.1% DMSO control in HEK293T and U2OS cells. h Rates of healthy, early apoptotic, late apoptotic, necrotic, and lysed cells after 24 h exposure of HEK293T or U2OS cells to 30 µM 41. i Fluorescent image of HEK293T cells after 24 h exposure to 30 µM 41 compared to 0.1% DMSO control (blue: Hoechst33342, green: Annexin V, red: Yo-Pro3). Full multiplex toxicity data in Supplementary Fig. 5. j Pilot profiling of 41 (10 mg/kg p.o.) in mice also confirmed target engagement in vivo as observed by upregulation of FXR (BSEP, SHP) and PPAR (LPL, PCK, CRAT) regulated genes in liver compared to vehicle-treated animals 12 h after administration. Results are the mean ± SEM, n = 3. **p < 0.01, *p < 0.05, #p < 0.1 (t test vs. vehicle).

