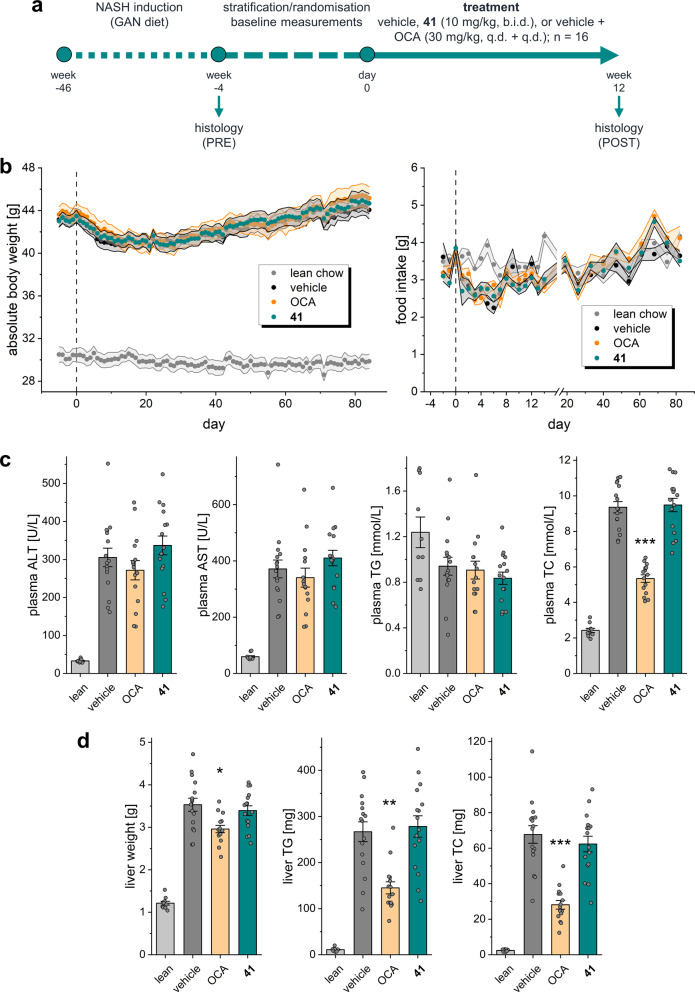
Fig. 7. Characterization of 41 in diet-induced obese (DIO) NASH in mice.
a Study outline. b Absolute body weight and food intake of mice during the treatment phase. c Biochemical parameters at termination (12 weeks of treatment) in the treatment groups. Results are the mean ± SEM. ***p < 0.001 vs. vehicle (Dunnett’s test one-factor linear model). d Liver parameters at termination (12 weeks of treatment) in the treatment groups. Results are the mean ± SEM. **p < 0.01, *p < 0.05 vs. vehicle (Dunnett’s test one-factor linear model). Sample sizes: n = 10 for lean chow, n = 15 for obeticholic acid, n = 16 for vehicle and 41.

