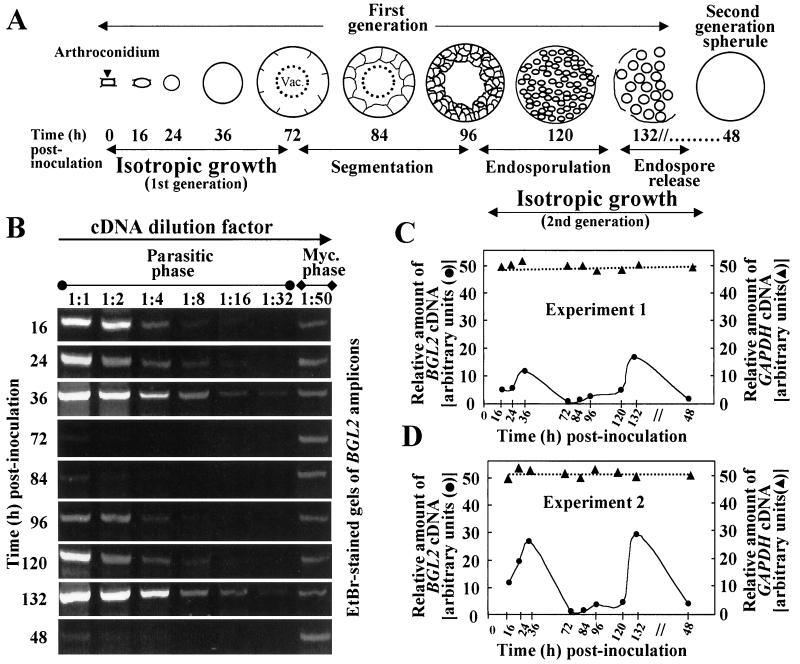
FIG. 7.
Diagrammatic representation of the parasitic cycle of C. immitis (A) and RT-PCR analysis of BGL2 and GAPDH expression (B to D). (A to D) Developmental stages of first- and second-generation parasitic cells are identified by incubation time after inoculation of the parasitic-phase cultures. (B) The EtBr-stained gels show BGL2 amplicons produced by RT-PCR as described in Materials and Methods. The dilution factors for the parasitic and mycelium phase-derived template cDNAs are indicated. The intensity of the gel bands was determined by densitometric analysis. (C and D) The relative amounts of BGL2 and GAPDH cDNAs are plotted as the dilution factor of the template cDNA that yielded the same EtBr-stained gel band intensity as that of the mycelial BGL2 amplicon using a cDNA template dilution of 1:50. The data presented in Experiment 1 (C) were derived from densitometric analysis of the gels shown in panel B.

