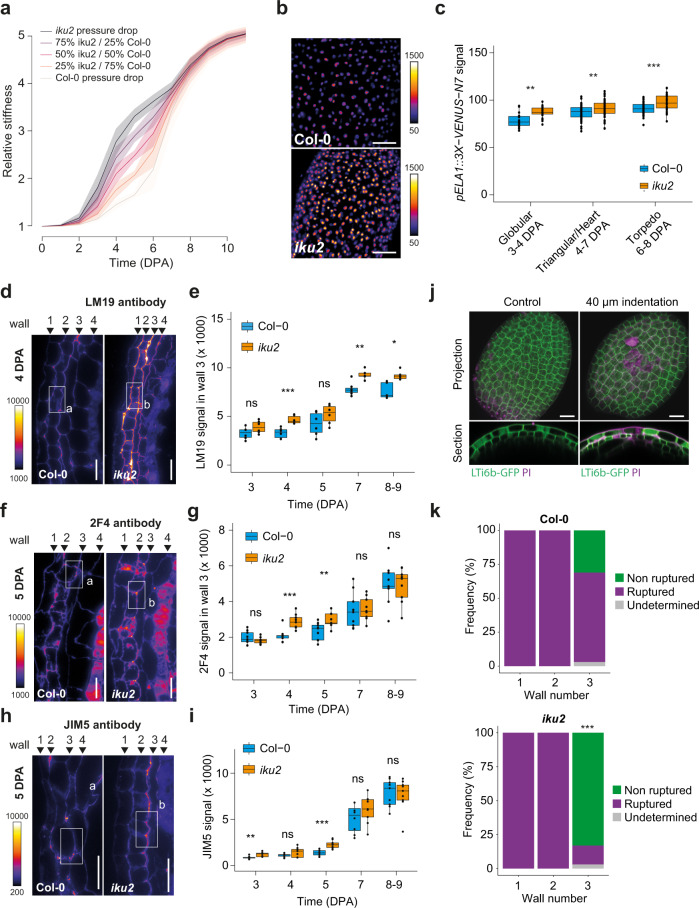
Fig. 3. Testa mechanical properties and response in Col-0 and iku2.
a Relative stiffness as a function of time using the drop functions displayed in Fig. 2e as inputs for pressure. All simulations were performed over the 100-parameter value sets best-fitting iku2 experimental data using iku2 drop function as an input for pressure. Plain curves display the mean dynamics and confidence intervals show standard deviations. b pELA1::3X-VENUS-N7 expression in Col-0 and iku2 seeds at the heart embryo stage. Scale bars: 50 µm. c Mean signal of pELA1::3X-VENUS-N7 reporter in nuclei of Col-0 and iku2 seeds (intensity unit/pixel). Seeds were classified according to embryo developmental stage (one experiment, Col-0, Globular: n = 15, Triangular/Heart: n = 68, Torpedo: n = 46; iku2, Globular: n = 25, Triangular/Heart: n = 58, Torpedo: n = 30). Fluorescent signals were compared using two-sided Student tests without adjustments for multiple comparisons, **p < 0.01, ***p < 0.001. d, f, h Signal from LM19 (d), 2F4 (f) and JIM5 (h) immunolocalizations on Col-0 and iku2 testas at 4-5 DPA. Scale bars: 20 µm. e, g, i Signal intensity from LM19 (e), 2F4 (g) and JIM5 (i) immunolocalizations in wall 3 of Col-0 and iku2 seeds as a function of time (LM19: two independent experiments, Col-0: 3 DPA: n = 9, 4 DPA: n = 9, 5 DPA: n = 10, 6 DPA: n = 8, 7–9 DPA: n = 9; iku2: 3 DPA: n = 9, 4 DPA: n = 9, 5 DPA: n = 9, 6 DPA: n = 9, 7–9 DPA: n = 9; 2F4: three independent experiments, Col-0: 3 DPA: n = 9, 4 DPA: n = 9, 5 DPA: n = 9, 6 DPA: n = 9, 7–9 DPA: n = 9; iku2: 3 DPA: n = 8, 4 DPA: n = 9, 5 DPA: n = 9, 6 DPA: n = 9, 7–9 DPA: n = 9, JIM5: three independent experiments, Col-0: 3 DPA: n = 9, 4 DPA: n = 9, 5 DPA: n = 10, 6 DPA: n = 8, 7–9 DPA: n = 9; iku2: 3 DPA: n = 9, 4 DPA: n = 9, 5 DPA: n = 9, 6 DPA: n = 9, 7–9 DPA: n = 9). Signal intensities were compared using two-sided Student tests without adjustments for multiple comparisons, *p < 0.05, **p < 0.01, *p < 0.001. j Maximum projection and z-section of a z-stack of WT seeds at 5 DPA expressing the membrane marker LTi6b-GFP (green) and stained with Propidium Iodide (magenta) without indentation or after a 40 µm depth indentation with a conical tip to rupture testa walls. A wall was considered to be ruptured when some intracellular PI staining was found in the underlying cell layer. Scale bars, 20 µm. k Quantification of testa wall rupture in Col-0 and iku2 following a 40 µm indentation with a conical tip. Two independent experiments (Col-0: n = 35, iku2: 36). Wall rupture frequencies were compared using a two-sided χ2 test, ***p < 0.00001. In all boxplots, the centerline shows the median; the box limits show the upper and lower quartiles; the whiskers correspond to 1.5× interquartile range. Individual points are superimposed in black.

