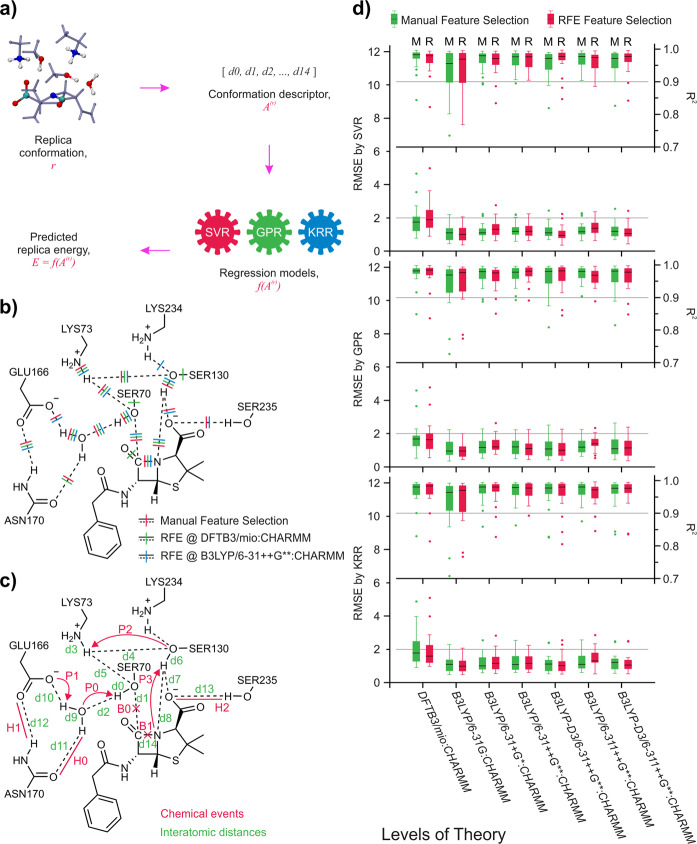
Fig. 3. Description of the predictive PES models, the results of feature selection, and the benchmark of the regression models.
a Schematic representation of the input/output data of the predictive PES models; b Features selected from RFE process with linear-kernel SVR and from manual selection, see also Supplementary Figs. 7 and 8; c Representations of interatomic distances used as the input feature vectors and the notation of chemical events; d Precision benchmark of regression models trained on datasets from various QM levels of theory. The “M” and “R” labels note the manual and RFE feature selected feature sets, respectively. Each box contains n = 18 prediction cases, the interquartile range (IQR) noted by the boxes are divided by the median (black lines), and the whiskers marks the first datum that are larger than 1.5 * IQR.

