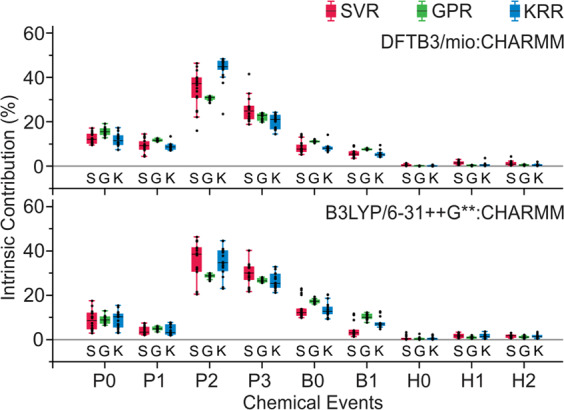
Fig. 5. Intrinsic energy contribution.

Intrinsic energy contribution measured on DFTB3/mio:CHARMM and B3LYP/6–31++G**:CHARMM reaction pathway profiles. The “S”, “G”, and “K” labels represent results from SVR, GPR, and KRR models, respectively. Each box contains n = 18 testing cases, the IQR noted by the boxes are divided by the median (black lines), and the whiskers mark the first datum that are larger than 1.5 * IQR. Joint contributions are measured for feature subgroups as defined in Supplementary Table 1. See also Supplementary Figs. 9, 10, and 143.
