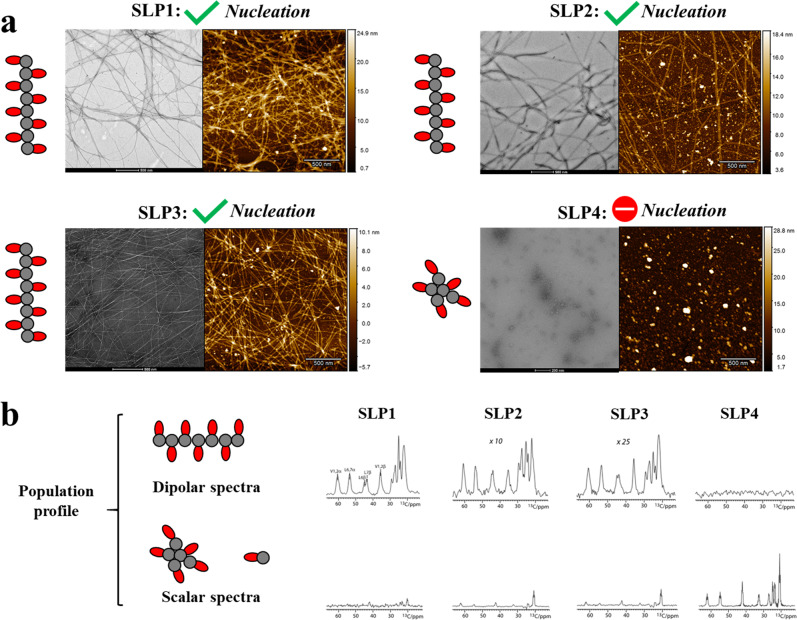
Fig. 3. Microscopic images of SLP assemblies and solid-state NMR-derived population profiles.
a Negative staining TEM (left panel) and AFM images (right panel) showing the assembled structures of SLP1–4. 1D nanofibers are formed with SLP1–3, indicating that nucleation event have taken place. Only 0D nanostructures are observed in SLP4, indicating that no nucleation event has taken place. b Population profiling of SLP assemblies by solid-state NMR spectroscopy. The dipolar cross‐polarization (CP) spectra report on rigid 1D nanofibers and the scalar INEPT spectra report on mobile species (micellar oligomers and monomeric SLP). The dipolar spectra were normalized (scaling factors of 10 and 25 for SLP2 and SLP3, respectively), while the intensity in scalar spectra directly reflects on the mobile population in the system. The spectra were measured at 500 MHz (1H frequency), 10 kHz magic angle spinning (MAS), and at 280 K sample temperature.

