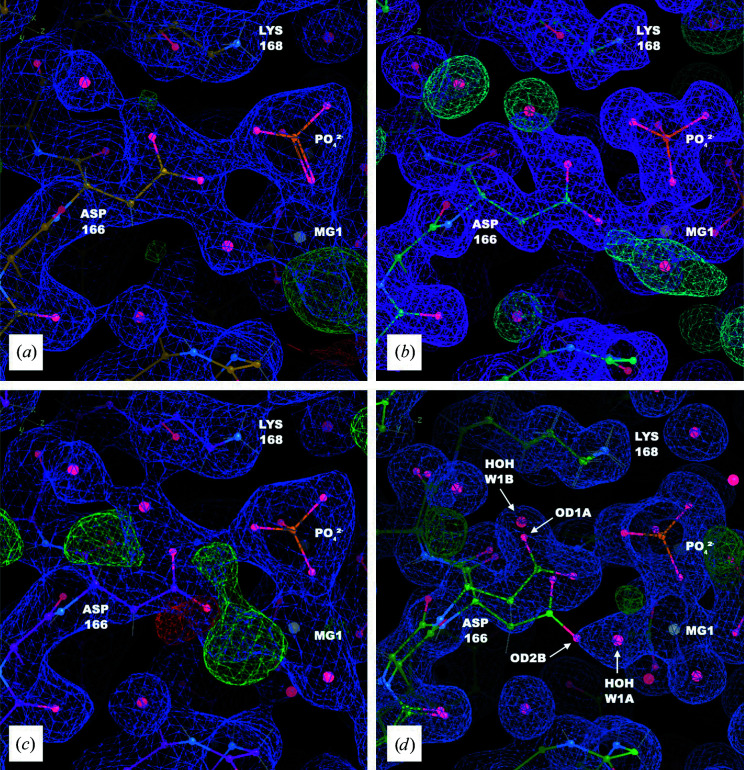
Figure 5.
The MD–MX procedure yields a multi-conformer model of Asp166. (a) Coordinates, 2F o − F c density (blue, 1σ isosurface) and F o − F c density (positive in green and negative in red, 3σ isosurface) from model S. (b) Coordinates from the M all model, with MD protein and cofactor density (purple, 1σ isosurface) and solvent density (blue, 3σ isosurface) from the 90–100 ns segment of the 200 kJ mol−1 nm−2 simulation. (c) Coordinates, 2F o − F c density (blue, 1σ isosurface) and F o − F c density (positive in green and negative in red, 3σ isosurface) from model R i. (d) Coordinates, 2F o − F c density (blue, 1σ isosurface) and F o − F c density (positive in green and negative in red, 3σ isosurface) from model R f refined against the high-resolution data (PDB entry 7v0g): the water in chain W associated with Asp166 (labeled HOH W1A/B) is modeled as a multi-conformer atom, with the A conformer adjacent to the magnesium and the B conformer adjacent to OD1 on the A conformer of the side chain.

