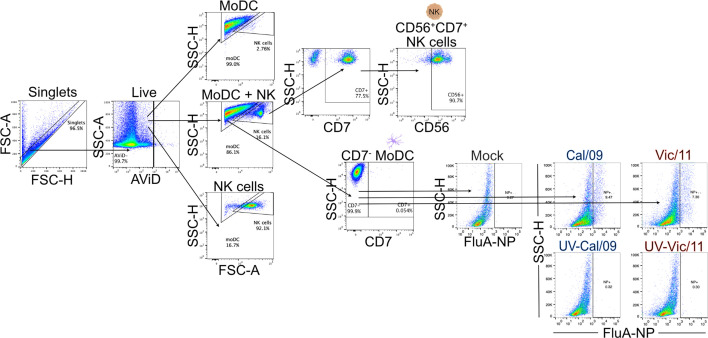
Figure 1.
Lineage gating schematic for MoDCs and NK cells. Diagram of lineage gating tree used to identify MoDCs and NK cells by flow cytometry. MoDCs and NK cells were separated into gates by size and granularity using forward and side scatter. MoDCs were further identified as CD7- while NK cells were identified as CD7+CD56+. Cal/09 and Vic/11 infection of MoDCs at an MOI of 3 at 24 HPI is shown using an antibody specific to IAV nucleoprotein (FluA-NP). AViD, LIVE/DEAD Fixable Violet Dead Cell Stain; FSC, forward scatter; SSC, side scatter.

