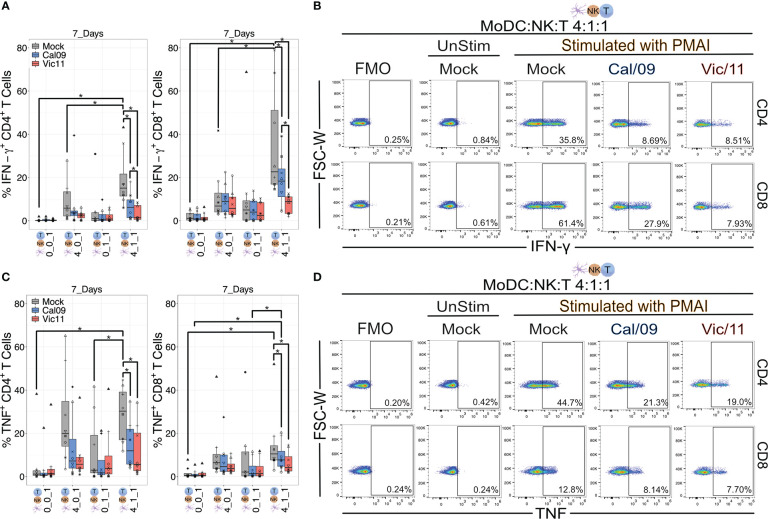
Figure 8.
IAV-exposed MoDCs in co-culture with NK cells suppress the production of IFN-γ and TNF from CD4+ and CD8+ T cells. Summary plots of CD4+ and CD8+ T cell IFN-γ+ (A) or (C) TNF+ expression after culture with mock-treated or Cal/09- or Vic/11-exposed MoDCs (MOI = 3) after 7-day co-culture with MoDCs and NK cells at a MoDC to NK cell to T cell ratio of 0:0:1, 4:0:1, 0:1:1 or 4:1:1 followed by stimulation with PMA/I for 4 h and assessed by intracellular cytokine staining and flow cytometry using an antibody specific to IFN-γ or TNF (n = 7). Representative flow plots of the frequency of IFN-γ+ (B) or (D) TNF+ CD4+ T cells (top) and CD8+ T cells (bottom) after 7-day co-culture with Cal/09- or Vic/11-exposed MoDCs (MOI = 3) at a MoDC to NK cell to T cell ratio of 4:1:1 followed by stimulation with PMA/I for 4 h and assessed by flow cytometry using an antibody specific to IFN-γ or TNF. The same shape between conditions indicates that the data point is derived from the same donor. *p < 0.05, Wilcoxon signed-rank test.

