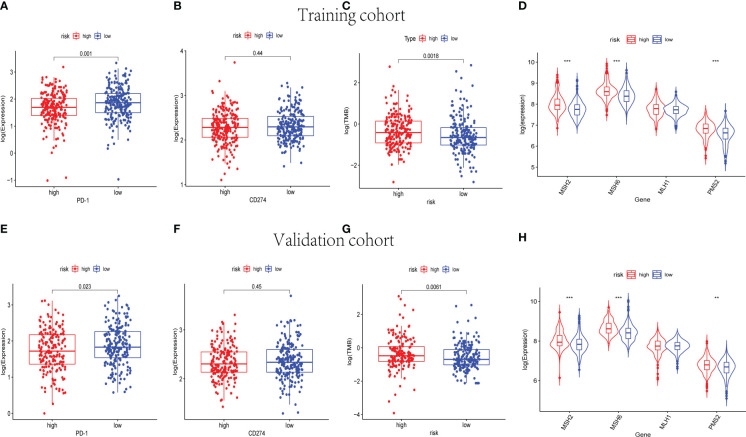
Figure 10.
The immunotherapy response prediction analysis for the nine-cuproptosis-related lncRNA risk model. The expression levels of immune checkpoint- related genes PD-1 and PDL-1 in training (A, B) and validation (E, F) groups (p< 0.05). The differences in TMB between the high- and low- risk sets in training (C) and validation (G) groups (p< 0.05). The expression of MMR genes of BC samples in training (D) and validation (H) sets, including MSH2, MSH6, MLH1, and PMS2. TMB, tumor mutational burden; MMR, mismatch repair; BC, breast cancer. ** indicated P < 0.01 and *** indicated P < 0.001.

