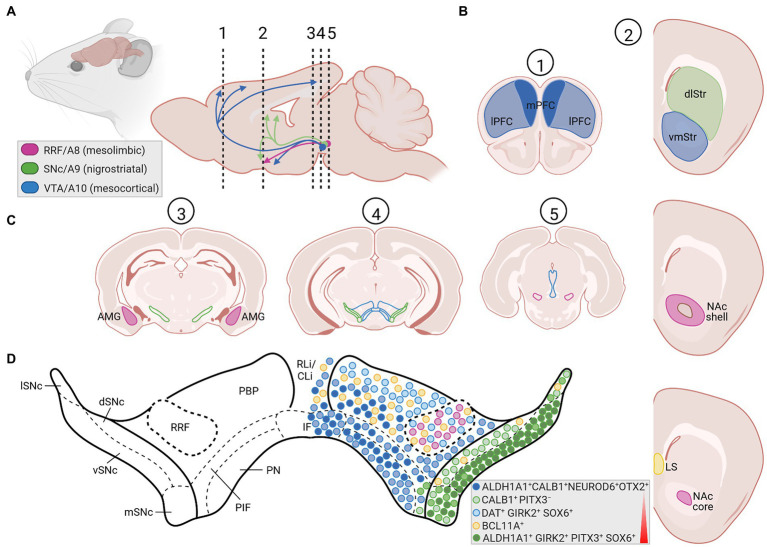
Figure 2.
The rodent mDA system in the adult brain. (A) Sagittal view (left) and enlarged midsagittal section (right) of the adult rodent (mouse, rat) brain, showing the location of the cell bodies (circles) from the A8 (RRF, pink), A9 (SNc, green), and A10 (VTA, blue) mDA clusters in the VM, and their projections (arrows) to the limbic areas (mesolimbic pathway), striatum (nigrostriatal pathway) and PFC (mesocortical pathway). Note that both the VTA and RRF DA neurons project to limbic areas in the mesolimbic pathway. The dotted and numbered lines indicate the position of the cross sections shown in (B,C). (B) Cross-sections of the rodent forebrain at the level of the dotted lines #1 and 2 in (A), depicting the location of the medial (mPFC, dark blue area) and lateral (lPFC, light blue area) PFC (#1) as one target area of the VTA DA subset, of the dorsolateral striatum (dlStr, green area), ventromedial striatum (vmStr, blue area), NAc shell or NAc core (pink area; right panel #2) as preferential target areas of the SNc, VTA and RRF DA subsets, respectively, and of the lateral septum (LS, yellow area) innervated by NEUROD6-and BCL11A-expressing mDA neurons. (C) Cross-sections at different rostro-caudal levels of the rodent midbrain, indicated by the dotted lines #3, 4 and 5 in (A), indicating the positions of the SNc (green lines), VTA (blue lines) and RRF (pink lines) DA subpopulations, as well as the location of the amygdala (AMG, pink area) as another target area in the mesolimbic pathway. Labeling of other brain regions in these sagittal and coronal views have been omitted for clarity. (D) Enlargement of the mDA region in the medial rodent VM [level of the dotted line and cross-section #4 in (A,C), respectively], showing the SNc (ventral tier, vSNc; dorsal tier, dSNc; medial tier, mSNc; and lateral tier, lSNc), VTA (PBP, parabrachial pigmented nucleus; PN, paranigral nucleus; IF, interfascicular nucleus; PIF, parainterfascicular nucleus; RLi, rostral linear nucleus; CLi, caudal linear nucleus of the raphe), and RRF subdivisions. Colored circles depict the approximate positions and proportions of mDA neurons with distinctive gene expression signatures (legend in bottom right corner) within these subdivisions, as summarized in this article. Colors and shadings indicate the increasing vulnerability (red triangle) of these mDA subsets to neurodegeneration. Intermediate shadings denote mDA subsets not defined here. Created with BioRender.com.

