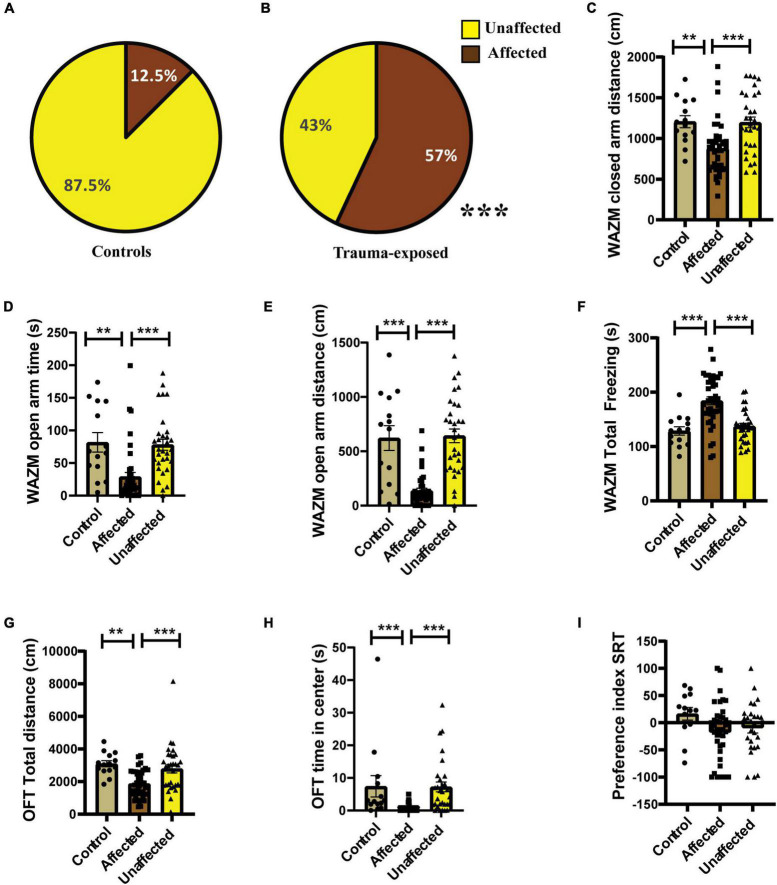
FIGURE 6.
Individual behavioral profiling-2 (IBP2) classified animals into affected or unaffected in different groups. (A) Percentage distribution of affected animals and unaffected animals in control group. (B) Percentage of affected animals was found to be significantly higher in trauma-exposed animals than controls at 2 weeks post UWT [(Fisher exact test, p*** < 0.001); Control (n = 16), trauma-exposed (n = 72)]. (C) Distance traveled in the closed arms of WAZM was least in the trauma affected animals [Kruskal–Wallis test H (3) = 18.25, (p = 0.0001); Dunn’s post-hoc test p** < 0.01, p*** < 0.0001]. (D) Time spent in the open arms of WAZM was less by the trauma affected animals than controls and trauma unaffected animals [Kruskal–Wallis test H (3) = 27.03, (p < 0.0001); Dunn’s post-hoc test p** < 0.01, p*** < 0.0001]. (E) Distance traveled in the open arms of WAZM was least in the trauma affected animals [Kruskal–Wallis test H (3) = 39.43, (p < 0.0001); Dunn’s post-hoc test p*** < 0.0001]. (F) Total time spent freezing in WAZM was highest by the trauma affected animals [Ordinary one-way ANOVA (F(2,85) = 17.69, p < 0.0001); Bonferroni’s post-hoc test p*** < 0.0001]. (G) Total distance travelled in the OFT was least by the trauma affected animals [Kruskal–Wallis test H (3) = 21.22, (p < 0.0001); Dunn’s post-hoc test p** < 0.01, p*** < 0.001]. (H) Time spent in the anxiogenic canter of the OFT was least by the trauma affected animals [Kruskal–Wallis test H (3) = 33.98, (p < 0.0001); Dunn’s post-hoc test p*** < 0.001]. (I) Preference index for unfamiliar animal in the SRT was not significantly different between the three groups. The controls and trauma unaffected individuals had no statistically different performance in any of the behavioral parameters [Ordinary-one way-ANOVA (F(2, 85) = 2.210, p = ns)]. All values are mean ± SEM. Controls (n = 16), trauma affected (n = 41), trauma unaffected (n = 31).

