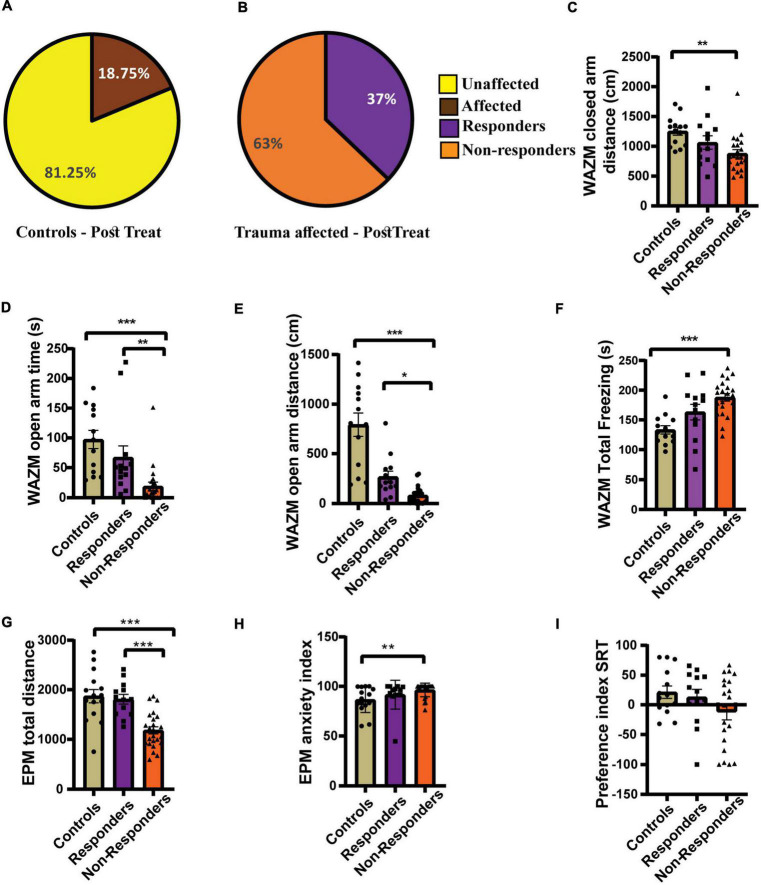
FIGURE 7.
Individual behavioral profiling 2 (IBP2) classified JVS+UWT affected animals as treatment responders and non-responders. (A) Percentage of affected and unaffected animals in the control group at the post-fluoxetine time point. (B) Percentage distribution of treatment responders and non-responders in the JVS+UWT affected group after fluoxetine treatment. (C) Distance travelled in the closed arms of the WAZM was less by the non-responders than the controls. [Kruskal–Wallis test H (3) = 12.42, (p = 0.002); Dunn’s post-hoc test p** < 0.01]. No statistical significance was found between responders and controls or non-responders. (D) Time spent in the open arms of WAZM was less by the non-responders than both controls and responders [Kruskal–Wallis test H (3) = 22.99, (p < 0.0001); Dunn’s post-hoc test p** < 0.01, p*** < 0.0001]. Responders had no significant difference with controls. (E) Distance travelled in the open arm of the WAZM was least by the non-responders while responders and controls covered similar distances [Kruskal–Wallis test H (3) = 29.21, (p < 0.0001); Dunn’s post-hoc test p* < 0.05, p*** < 0.0001]. (F) Total time spent freezing in the WAZM was higher in the non-responders than controls. [Ordinary one-way ANOVA (F(2,48) = 10.52, p = 0.0002); Bonferroni’s post-hoc test p*** < 0.0001]. No significant difference was observed in the time spent freezing in WAZM between responders and controls or non-responders. (G) Total distance travelled in the EPM was least in the non-responders while responders and controls spent similar distance [Ordinary one-way ANOVA (F(2,48) = 17.23, p < 0.00001); Bonferroni’s post-hoc test p*** < 0.0001]. (H) Anxiety index in the EPM in the non-responders was higher than the controls [Kruskal–Wallis test H (3) = 10.85, (p = 0.0044); Dunn’s post-hoc test p** < 0.01]. No significant difference was observed between responders and controls or non-responders. (I) Preference index for unfamiliar animal in the SRT was not significantly different between the three groups controls [Kruskal–Wallis test (H (3) = 1.979, p = ns)]. All data represented as mean ± SEM. Controls (n = 16) treatment responders (n = 13), treatment non-responders (n = 22).

