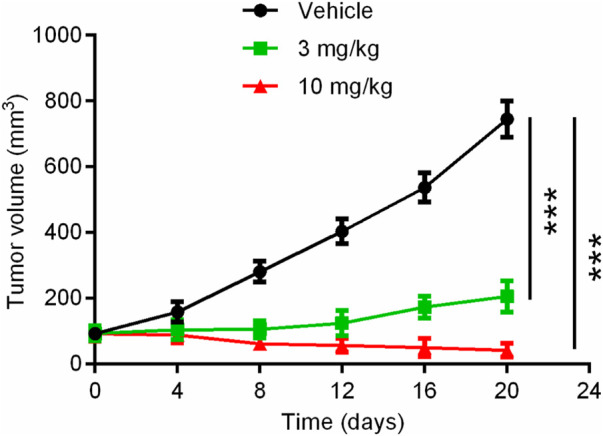
FIGURE 8.

Mean tumor volume as a function of time (days) after the treatment of the hit compound 3. Data are represented as mean ± SD, n = 5. ***p < .001.

Mean tumor volume as a function of time (days) after the treatment of the hit compound 3. Data are represented as mean ± SD, n = 5. ***p < .001.