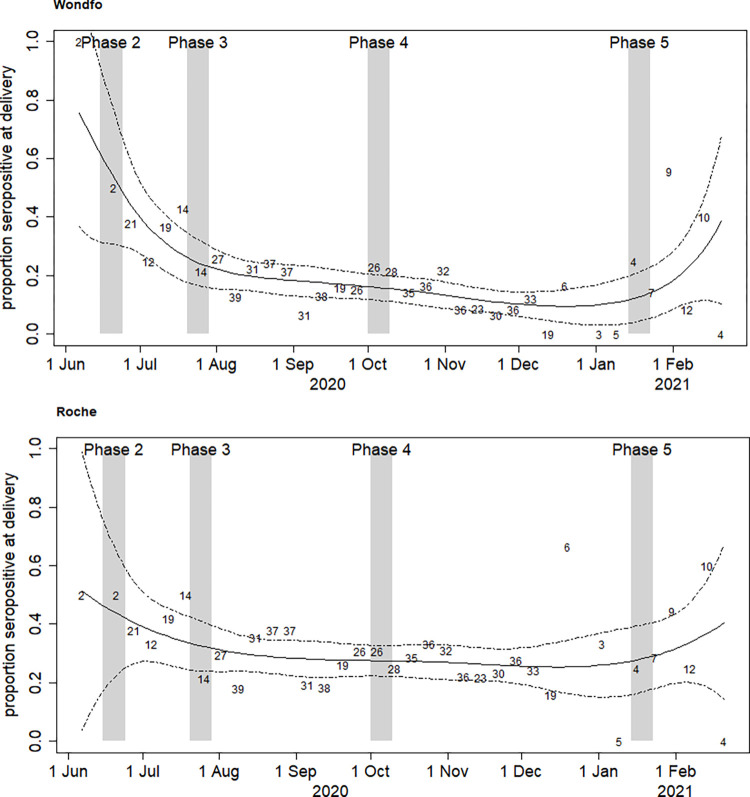
Fig 2.
SARS-CoV-2 seroprevalence over time (June 2020-February 2021) among pregnant women at delivery in São Paulo, by Wondfo (Panel A) and Roche Elecsys (Panel B) assays. The grey bars show the dates of the second to fifth household surveys (HHS). The first survey is not shown because it was before the start of the study in pregnant women (see dates in Table 3). The numbers in the body of the figure are the numbers tested in each epidemiological week. The solid line is the estimate of the proportion seropositive from the spline fit, and the two dashed line are the 95% confidence limits.

