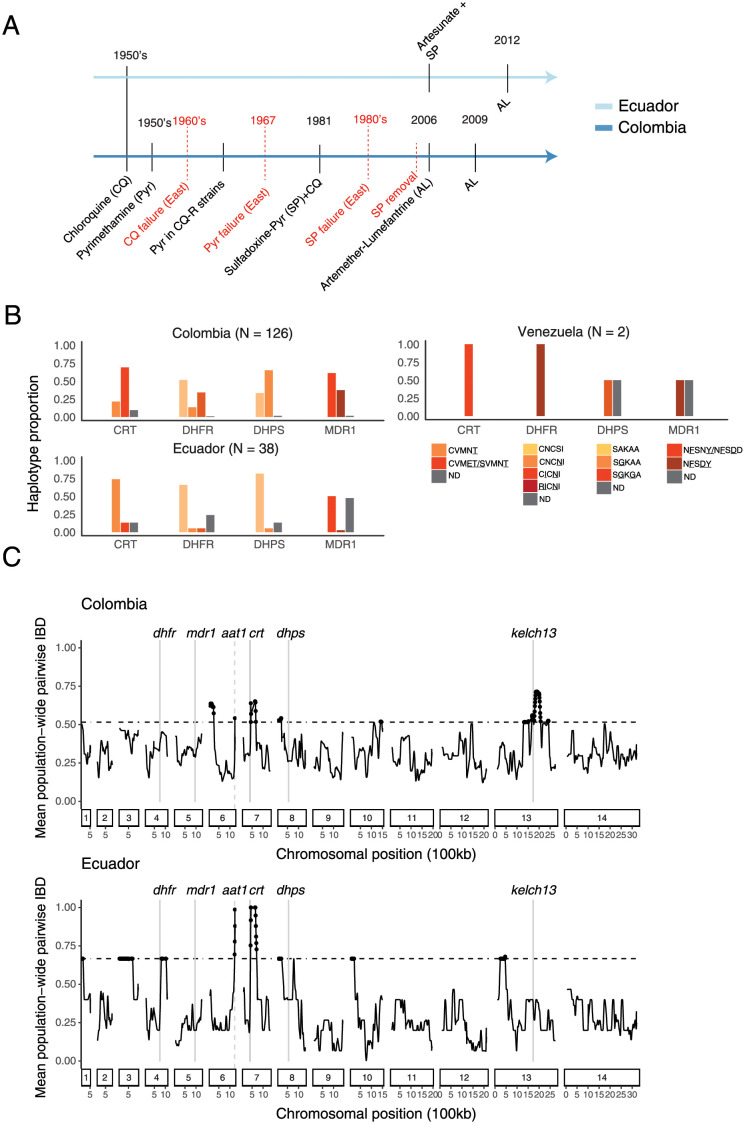
Fig 5. Drug selection across the Pacific Coast Region.
(A) Timeline of official antimalarial usage for treatment of P. falciparum malaria (black) and documented emergence of antimalarial resistance (red) in Ecuador (light blue) and Colombia (dark blue). Data are based on epidemiological information from the respective country-level Institutes of Health. (B) Drug-resistance haplotypes in the 166 monoclonal samples collected 2013–2017, colored by wild-type (WT) allele, or by the drug resistance haplotype shown as the amino acid sequence, with an underline referring to the known functional mutations, or in gray for haplotypes not-determined from read coverage (ND). Drug-resistance haplotypes at the cluster level are available in S2 Table. (C) Mean pairwise IBD within 50-kb overlapping windows across the genome (y-axis) for Ecuador and Colombia. IBD calculations were made using one representative sample per clonal cluster. Horizontal lines mark the 95th percentile for Ecuador (bottom) and Colombia (top). Vertical gray lines mark the chromosomal positions of genes with known involvement in antimalarial resistance.

